
Page 682 - Automotive Engineering Powertrain Chassis System and Vehicle Body
P. 682
Interior noise: Assessment and control C HAPTER 21.1
connected to the receiver via sprung or compliant 6. With the engine still removed from the vehicle,
mounts and there is a reasonable differential movement measure the noise transfer functions (NTFs)
across each mount. For example, the complex stiffness
method is commonly applied to the engine mounting P
NTF ¼ P is the sound pressure ðPaÞ
problem thus:
F i
1. Identify all probable vibration paths between the (21.1.17)
source (the engine) and the receiver (a microphone
positioned in the passenger compartment). using the force excitation from (5) and a microphone
in the passenger compartment.
2. Organiseaphasereferencesignalforuseinsubsequent
measurements.Thismightbeanelectricalsignaltaken 7. Measure the dynamic stiffness of each engine
from the tachometer or the conditioned output from mount along with its damping. These may be com-
an accelerometer attached to the engine block. bined to give a complex stiffness (Cremer and
Heckl, 1988)
3. On the test track, or the rolling-road dynamometer,
measure acceleration levels in the three axes (x, y, z) K ¼ Kð1 þ ihÞ (21.1.18)
on the engine side of the engine mounts. Analyse
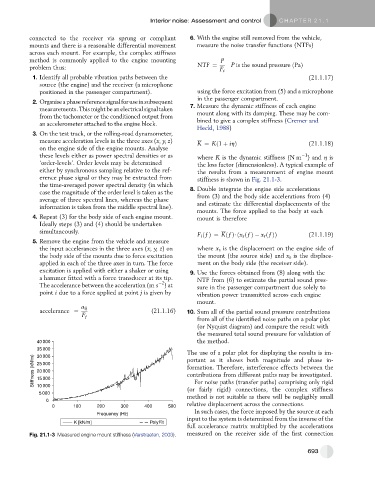
these levels either as power spectral densities or as where K is the dynamic stiffness (N m ) and h is
1
‘order-levels’. Order levels may be determined the loss factor (dimensionless). A typical example of
either by synchronous sampling relative to the ref- the results from a measurement of engine mount
erence phase signal or they may be extracted from stiffness is shown in Fig. 21.1-3.
the time-averaged power spectral density (in which 8. Double integrate the engine side accelerations
case the magnitude of the order level is taken as the from (3) and the body side accelerations from (4)
average of three spectral lines, whereas the phase and estimate the differential displacements of the
information is taken from the middle spectral line).
mounts. The force applied to the body at each
4. Repeat (3) for the body side of each engine mount. mount is therefore
Ideally steps (3) and (4) should be undertaken
simultaneously.
F i ðf Þ¼ Kðf Þ$ðx s ðf Þ x r ðf ÞÞ (21.1.19)
5. Remove the engine from the vehicle and measure
the input accelerances in the three axes (x, y, z)on where x s is the displacement on the engine side of
the body side of the mounts due to force excitation the mount (the source side) and x r is the displace-
applied in each of the three axes in turn. The force ment on the body side (the receiver side).
excitation is applied with either a shaker or using 9. Use the forces obtained from (8) along with the
a hammer fitted with a force transducer at its tip. NTF from (6) to estimate the partial sound pres-
2
The accelerance between the acceleration (m s )at sure in the passenger compartment due solely to
point i due to a force applied at point j is given by vibration power transmitted across each engine
mount.
a ij
accelerance ¼ (21.1.16) 10. Sum all of the partial sound pressure contributions
F j
from all of the identified noise paths on a polar plot
(or Nyquist diagram) and compare the result with
the measured total sound pressure for validation of
40 000 the method.
35 000
The use of a polar plot for displaying the results is im-
30 000
Stiffness (kN/m) 25 000 formation. Therefore, interference effects between the
portant as it shows both magnitude and phase in-
20 000
contributions from different paths may be investigated.
15 000
For noise paths (transfer paths) comprising only rigid
10 000
(or fairly rigid) connections, the complex stiffness
5 000
method is not suitable as there will be negligibly small
0
0 100 200 300 400 500 relative displacement across the connections.
In such cases, the force imposed by the source at each
Frequency (Hz)
input to the system is determined from the inverse of the
K [kN/m] PolyFit
full accelerance matrix multiplied by the accelerations
Fig. 21.1-3 Measured engine mount stiffness (Verstraeten, 2003). measured on the receiver side of the first connection
693