
Page 557 - Design for Six Sigma a Roadmap for Product Development
P. 557
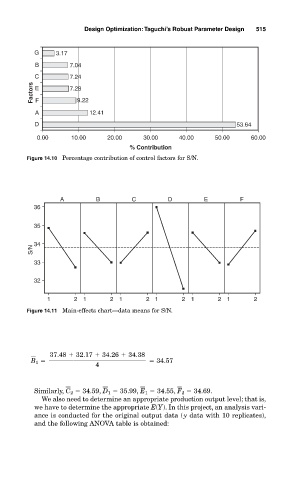
Design Optimization:Taguchi’s Robust Parameter Design  515


             G     3.17
              B        7.04
              C        7.24
             Factors  E  7.28

              F
                         9.22
              A             12.41
              D                                                     53.64

              0.00     10.00     20.00     30.00     40.00    50.00     60.00
                                       % Contribution
           Figure 14.10 Percentage contribution of control factors for S/N.


                    A         B         C         D        E         F
             36

             35


             34
             S/N
             33

             32

                 1      2 1       2 1       2 1      2 1       2 1       2
           Figure 14.11 Main-effects chart—data means for S/N.


                  37.48   32.17   34.26   34.38
             B   1                             34.57
                              4


             Similarly, C   2   34.59, D  1   35.99, E  1   34.55, F  2   34.69.
               We also need to determine an appropriate production output level; that is,
             we have to determine the appropriate E(Y). In this project, an analysis vari-
             ance is conducted for the original output data (y data with 10 replicates),
             and the following ANOVA table is obtained: