
Page 558 - Design for Six Sigma a Roadmap for Product Development
P. 558
516 Chapter Fourteen
315
305
295
Output per 30s 285
275
265
255
245
235
225
1 1
G
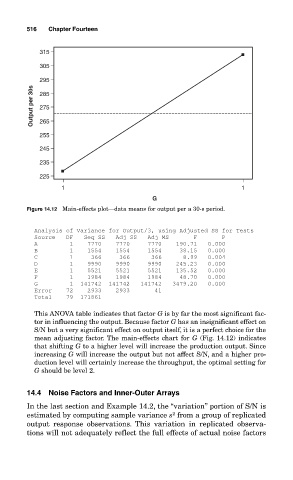
Figure 14.12 Main-effects plot—data means for output per a 30-s period.
Analysis of Variance for Output/3, using Adjusted SS for Tests
Source DF Seq SS Adj SS Adj MS F P
A 1 7770 7770 7770 190.71 0.000
B 1 1554 1554 1554 38.15 0.000
C 1 366 366 366 8.99 0.004
D 1 9990 9990 9990 245.23 0.000
E 1 5521 5521 5521 135.52 0.000
F 1 1984 1984 1984 48.70 0.000
G 1 141742 141742 141742 3479.20 0.000
Error 72 2933 2933 41
Total 79 171861
This ANOVA table indicates that factor G is by far the most significant fac-
tor in influencing the output. Because factor G has an insignificant effect on
S/N but a very significant effect on output itself, it is a perfect choice for the
mean adjusting factor. The main-effects chart for G (Fig. 14.12) indicates
that shifting G to a higher level will increase the production output. Since
increasing G will increase the output but not affect S/N, and a higher pro-
duction level will certainly increase the throughput, the optimal setting for
G should be level 2.
14.4 Noise Factors and Inner-Outer Arrays
In the last section and Example 14.2, the “variation” portion of S/N is
2
estimated by computing sample variance s from a group of replicated
output response observations. This variation in replicated observa-
tions will not adequately reflect the full effects of actual noise factors