
Page 564 - Design for Six Sigma a Roadmap for Product Development
P. 564
522 Chapter Fourteen
metal ions is very harmful because of its toxicity and nonbiodegradable
nature. It is proposed to use hydrated iron oxides [Fe(II)] with an appropriate
pH level to remove these harmful metal ions. The objective of this project is
to remove as many metal ions as possible from the wastewater. The output
quality characteristic is the total remaining (metal) concentration [TRC; in
milligrams per liter (mg/L)], which is a smaller-the-better quality charac-
teristic. The following four control factors are identified:
Control factors Level 1 Level 2 Level 3
F Fe(II)/(total metal in solution) 2 7 15
T Temperature, °C 25 50 75
H Aging time, h 1 2 3
P pH 8 10 12
The variability in the composition of wastewater is considered to be the noise
factor. In this Taguchi parameter design project, artificially introduced potas-
sium permanganate is used to simulate the noise factor as follows:
Noise factor Level 1 Level 2 Level 3
N KMnO 4 3.75
10 3 3.75
10 2 7.5
10 2
concentration, mol/L
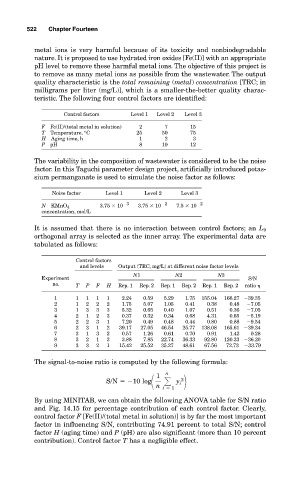
It is assumed that there is no interaction between control factors; an L 9
orthogonal array is selected as the inner array. The experimental data are
tabulated as follows:
Control factors
and levels Output (TRC, mg/L) at different noise factor levels
N1 N2 N3
Experiment S/N
no. T P F H Rep. 1 Rep. 2 Rep. 1 Rep. 2 Rep. 1 Rep. 2 ratio
1 1 1 1 1 2.24 0.59 5.29 1.75 155.04 166.27 39.35
2 1 2 2 2 1.75 5.07 1.05 0.41 0.38 0.48 7.05
3 1 3 3 3 5.32 0.65 0.40 1.07 0.51 0.36 7.05
4 2 1 2 3 0.37 0.32 0.34 0.68 4.31 0.65 5.19
5 2 2 3 1 7.20 0.49 0.48 0.44 0.80 0.88 9.54
6 2 3 1 2 39.17 27.05 46.54 25.77 138.08 165.61 39.34
7 3 1 3 2 0.57 1.26 0.61 0.70 0.91 1.42 0.28
8 3 2 1 3 3.88 7.85 22.74 36.33 92.80 120.33 36.20
9 3 3 2 1 15.42 25.52 35.27 48.61 67.56 72.73 33.79
The signal-to-noise ratio is computed by the following formula:
1 n
S/N 10 log 2
n
y i
i 1
By using MINITAB, we can obtain the following ANOVA table for S/N ratio
and Fig. 14.15 for percentage contribution of each control factor. Clearly,
control factor F [Fe(II)/(total metal in solution)] is by far the most important
factor in influencing S/N, contributing 74.91 percent to total S/N; control
factor H (aging time) and P (pH) are also significant (more than 10 percent
contribution). Control factor T has a negligible effect.