
Page 565 - Design for Six Sigma a Roadmap for Product Development
P. 565
Design Optimization:Taguchi’s Robust Parameter Design 523
T 2.49
Control Factor H 10.32
P
12.28
F 74.91
0.00 10.00 20.00 30.00 40.00 50.00 60.00 70.00 80.00
% Contribution
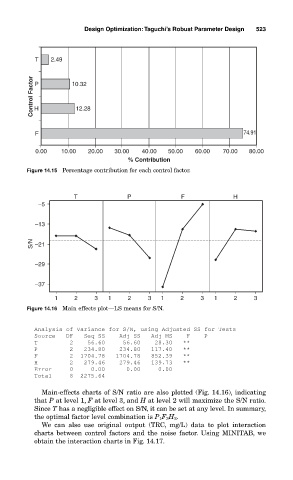
Figure 14.15 Percentage contribution for each control factor.
T P F H
–5
–13
S/N –21
–29
–37
1 2 3 1 2 3 1 2 3 1 2 3
Figure 14.16 Main effects plot—LS means for S/N.
Analysis of Variance for S/N, using Adjusted SS for Tests
Source DF Seq SS Adj SS Adj MS F P
T 2 56.60 56.60 28.30 **
P 2 234.80 234.80 117.40 **
F 2 1704.78 1704.78 852.39 **
H 2 279.46 279.46 139.73 **
Error 0 0.00 0.00 0.00
Total 8 2275.64
Main-effects charts of S/N ratio are also plotted (Fig. 14.16), indicating
that P at level 1, F at level 3, and H at level 2 will maximize the S/N ratio.
Since T has a negligible effect on S/N, it can be set at any level. In summary,
the optimal factor level combination is P 1 F 3 H 2 .
We can also use original output (TRC, mg/L) data to plot interaction
charts between control factors and the noise factor. Using MINITAB, we
obtain the interaction charts in Fig. 14.17.