Page 566 - Design for Six Sigma a Roadmap for Product Development
P. 566

524   Chapter Fourteen


                         1   2   3    1  2    3   1   2   3   1   2   3
                 T
              3                                                          100
              2                                                          50
              1
                                                                         0
                             P
                          3                                              100
                          2                                              50
                          1
                                                                         0
                                         F
                                       3                                 100
                                       2                                 50
                                       1
                                                                         0
                                                     H
                                                   3                     100
                                                   2                     50
                                                   1
                                                                         0
                                                                  N


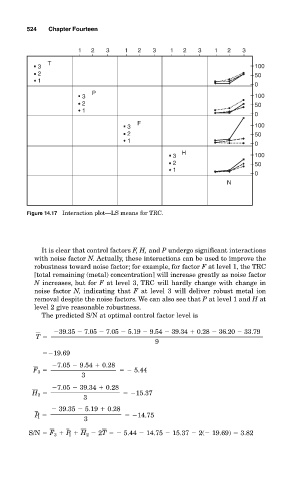
           Figure 14.17 Interaction plot—LS means for TRC.


               It is clear that control factors F, H, and P undergo significant interactions
             with noise factor N. Actually, these interactions can be used to improve the
             robustness toward noise factor; for example, for factor F at level 1, the TRC
             [total remaining (metal) concentration] will increase greatly as noise factor
             N increases, but for F at level 3, TRC will hardly change with change in
             noise factor  N, indicating that  F at level 3 will deliver robust metal ion
             removal despite the noise factors. We can also see that P at level 1 and H at
             level 2 give reasonable robustness.
               The predicted S/N at optimal control factor level is
                    39.35   7.05   7.05   5.19   9.54   39.34   0.28   36.20   33.79
              T
                                              9
                  19.69
                   7.05   9.54   0.28
             F   3                      5.44
                          3
                   7.05   39.34   0.28
             H   2                      15.37
                           3
                    39.35   5.19   0.28
              P   1                      14.75
                           3
            S/N   F   3   P  1   H  2   2T     5.44   14.75   15.37   2(  19.69)   3.82
   561   562   563   564   565   566   567   568   569   570   571