
Page 568 - Design for Six Sigma a Roadmap for Product Development
P. 568
526 Chapter Fourteen
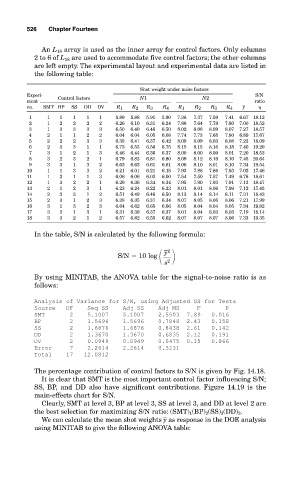
An L 18 array is used as the inner array for control factors. Only columns
2 to 6 of L 18 are used to accommodate five control factors; the other columns
are left empty. The experimental layout and experimental data are listed in
the following table:
Shot weight under noise factors
Experi- Control factors N1 N2 S/N
ment ratio
no. SMT BP SS DD DV R 1 R 2 R 3 R 4 R 1 R 2 R 3 R 4 y
1 1 1 1 1 1 5.89 5.88 5.91 5.90 7.38 7.37 7.59 7.41 6.67 18.12
2 1 2 2 2 2 6.26 6.10 6.31 6.24 7.86 7.64 7.79 7.80 7.00 18.52
3 1 3 3 3 3 6.50 6.40 6.46 6.50 8.02 8.08 8.09 8.07 7.27 18.57
4 2 1 1 2 2 6.04 6.04 6.05 6.08 7.74 7.73 7.68 7.80 6.89 17.67
5 2 2 2 3 3 6.35 6.41 6.37 6.42 8.09 8.09 8.03 8.08 7.23 18.09
6 2 3 3 1 1 6.73 6.55 6.56 6.75 8.15 8.15 8.16 8.18 7.40 19.20
7 3 1 2 1 3 6.46 6.44 6.36 6.37 8.00 8.00 8.00 8.01 7.20 18.53
8 3 2 3 2 1 6.79 6.83 6.81 6.80 8.09 8.12 8.10 8.10 7.45 20.64
9 3 3 1 3 2 6.63 6.63 6.61 6.61 8.06 8.10 8.01 8.10 7.34 19.54
10 1 1 3 3 2 6.21 6.01 6.21 6.15 7.93 7.88 7.86 7.93 7.02 17.46
11 1 2 1 1 3 6.06 6.06 6.03 6.00 7.54 7.50 7.57 7.49 6.78 18.61
12 1 3 2 2 1 6.29 6.36 6.34 6.34 7.95 7.90 7.93 7.91 7.13 18.47
13 2 1 2 3 1 6.23 6.24 6.22 6.23 8.01 8.01 8.06 7.99 7.12 17.45
14 2 2 3 1 2 6.51 6.49 6.46 6.50 8.13 8.14 8.14 8.11 7.31 18.42
15 2 3 1 2 3 6.38 6.35 6.37 6.34 8.07 8.05 8.06 8.06 7.21 17.99
16 3 1 3 2 3 6.64 6.62 6.65 6.66 8.05 8.04 8.04 8.05 7.34 19.82
17 3 2 1 3 1 6.31 6.39 6.37 6.37 8.01 8.04 8.03 8.03 7.19 18.14
18 3 3 2 1 2 6.57 6.62 6.55 6.62 8.07 8.07 8.07 8.06 7.33 19.35
In the table, S/N is calculated by the following formula:
2
y
S/N 10 log
s 2
By using MINITAB, the ANOVA table for the signal-to-noise ratio is as
follows:
Analysis of Variance for S/N, using Adjusted SS for Tests
Source DF Seq SS Adj SS Adj MS F P
SMT 2 5.1007 5.1007 2.5503 7.89 0.016
BP 2 1.5696 1.5696 0.7848 2.43 0.158
SS 2 1.6876 1.6876 0.8438 2.61 0.142
DD 2 1.3670 1.3670 0.6835 2.12 0.191
DV 2 0.0949 0.0949 0.0475 0.15 0.866
Error 7 2.2614 2.2614 0.3231
Total 17 12.0812
The percentage contribution of control factors to S/N is given by Fig. 14.18.
It is clear that SMT is the most important control factor influencing S/N;
SS, BP, and DD also have significant contributions. Figure 14.19 is the
main-effects chart for S/N.
Clearly, SMT at level 3, BP at level 3, SS at level 3, and DD at level 2 are
the best selection for maximizing S/N ratio: (SMT) 1 (BP) 2 (SS) 3 (DD) 2 .
We can calculate the mean shot weights y as response in the DOE analysis
using MINITAB to give the following ANOVA table: