
Page 506 - Elements of Chemical Reaction Engineering Ebook
P. 506
Sec. 8.4 Equilibrium Conversion 477
X
350 400 450 500 550 600
TO
‘0
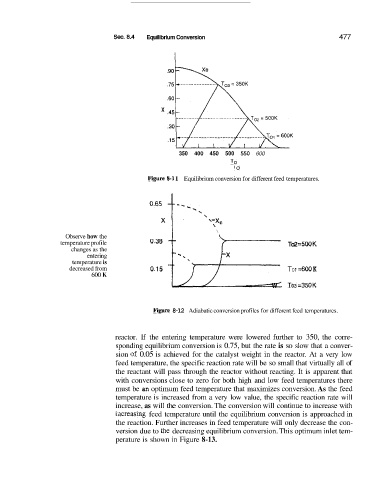
Figuire 8-3 1 Equilibrium conversion for different feed temperatures.
Observe how the I \ \
temperature profile To2 =5OO K
changes as the
entering o*38 3-
temperature is
decreased from 0.15 TO 1 =600 K
600 K W TO3 =350K
Figgwe 8-12 Adiabatic conversion profiles for different feed temperatures.
reactor. If the entering temperature were lowered further to 350, the corre-
sponding equilibrium conversion is 0.75, but the rate is so slow that a conver-
sion of 0.05 is achieved for the catalyst weight in the reactor. At a very low
feed temperature, the specific reaction rate will be so small that virtually all of
the reactant will pass through the reactor without reacting. It is apparent that
with conversions close to zero for both high and low feed temperatures there
must be an optimum feed temperature that maximizes conversion. As the feed
temperature is increased from a very low value, the specific reaction rate will
increase, as will the conversion. The conversion will continue to increase with
illcreasing feed temperature until the equilibrium conversion is approached in
the reaction. Further increases in feed temperature will only decrease the con-
version due to the decreasing equilibrium conversion. This optimum inlet tem-
perature is shown in Figure 8-13.