
Page 451 - Enhanced Oil Recovery in Shale and Tight Reservoirs
P. 451
418 Enhanced Oil Recovery in Shale and Tight Reservoirs
3
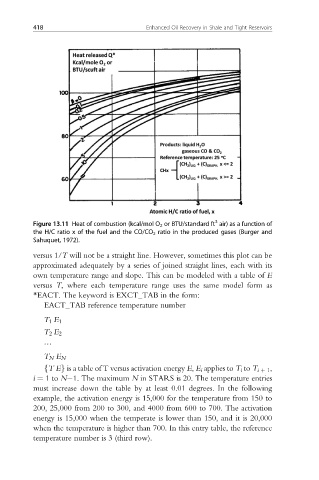
Figure 13.11 Heat of combustion (kcal/mol O 2 or BTU/standard ft air) as a function of
the H/C ratio x of the fuel and the CO/CO 2 ratio in the produced gases (Burger and
Sahuquet, 1972).
versus 1/T will not be a straight line. However, sometimes this plot can be
approximated adequately by a series of joined straight lines, each with its
own temperature range and slope. This can be modeled with a table of E
versus T, where each temperature range uses the same model form as
*EACT. The keyword is EXCT_TAB in the form:
EACT_TAB reference temperature number
T 1 E 1
T 2 E 2
/
T N E N
fTEg is a table of T versus activation energy E, E i applies to T i to T i þ 1 ,
i ¼ 1to N 1. The maximum N in STARS is 20. The temperature entries
must increase down the table by at least 0.01 degrees. In the following
example, the activation energy is 15,000 for the temperature from 150 to
200, 25,000 from 200 to 300, and 4000 from 600 to 700. The activation
energy is 15,000 when the temperate is lower than 150, and it is 20,000
when the temperature is higher than 700. In this entry table, the reference
temperature number is 3 (third row).