
Page 453 - Enhanced Oil Recovery in Shale and Tight Reservoirs
P. 453
420 Enhanced Oil Recovery in Shale and Tight Reservoirs
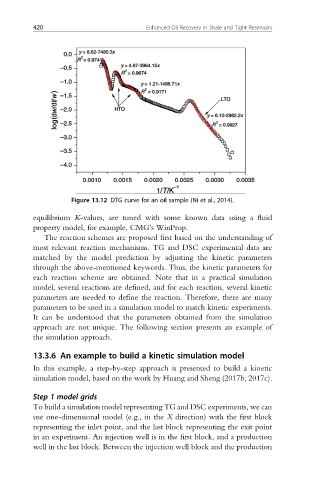
Figure 13.12 DTG curve for an oil sample (Ni et al., 2014).
equilibrium K-values, are tuned with some known data using a fluid
property model, for example, CMG’s WinProp.
The reaction schemes are proposed first based on the understanding of
most relevant reaction mechanisms. TG and DSC experimental data are
matched by the model prediction by adjusting the kinetic parameters
through the above-mentioned keywords. Thus, the kinetic parameters for
each reaction scheme are obtained. Note that in a practical simulation
model, several reactions are defined, and for each reaction, several kinetic
parameters are needed to define the reaction. Therefore, there are many
parameters to be used in a simulation model to match kinetic experiments.
It can be understood that the parameters obtained from the simulation
approach are not unique. The following section presents an example of
the simulation approach.
13.3.6 An example to build a kinetic simulation model
In this example, a step-by-step approach is presented to build a kinetic
simulation model, based on the work by Huang and Sheng (2017b, 2017c).
Step 1 model grids
To build a simulation model representing TG and DSC experiments, we can
use one-dimensional model (e.g., in the X direction) with the first block
representing the inlet point, and the last block representing the exit point
in an experiment. An injection well is in the first block, and a production
well in the last block. Between the injection well block and the production