
Page 454 - Enhanced Oil Recovery in Shale and Tight Reservoirs
P. 454
Air injection 421
1
0.9
0.8
kr - relative permeability 0.6 krg
0.7
0.5
krog
0.4
0.3
0.2
0.1
0
0 0.2 0.4 0.6 0.8 1
Sl
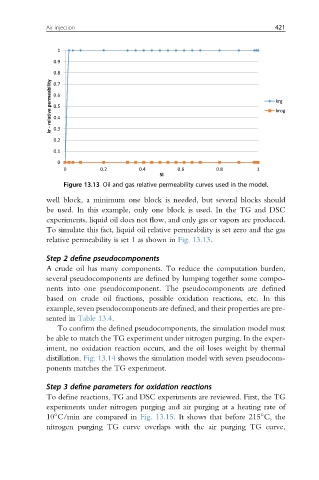
Figure 13.13 Oil and gas relative permeability curves used in the model.
well block, a minimum one block is needed, but several blocks should
be used. In this example, only one block is used. In the TG and DSC
experiments, liquid oil does not flow, and only gas or vapors are produced.
To simulate this fact, liquid oil relative permeability is set zero and the gas
relative permeability is set 1 as shown in Fig. 13.13.
Step 2 define pseudocomponents
A crude oil has many components. To reduce the computation burden,
several pseudocomponents are defined by lumping together some compo-
nents into one pseudocomponent. The pseudocomponents are defined
based on crude oil fractions, possible oxidation reactions, etc. In this
example, seven pseudocomponents are defined, and their properties are pre-
sented in Table 13.4.
To confirm the defined pseudocomponents, the simulation model must
be able to match the TG experiment under nitrogen purging. In the exper-
iment, no oxidation reaction occurs, and the oil loses weight by thermal
distillation. Fig. 13.14 shows the simulation model with seven pseudocom-
ponents matches the TG experiment.
Step 3 define parameters for oxidation reactions
To define reactions, TG and DSC experiments are reviewed. First, the TG
experiments under nitrogen purging and air purging at a heating rate of
10 C/min are compared in Fig. 13.15. It shows that before 215 C, the
nitrogen purging TG curve overlaps with the air purging TG curve,