
Page 456 - Enhanced Oil Recovery in Shale and Tight Reservoirs
P. 456
Air injection 423
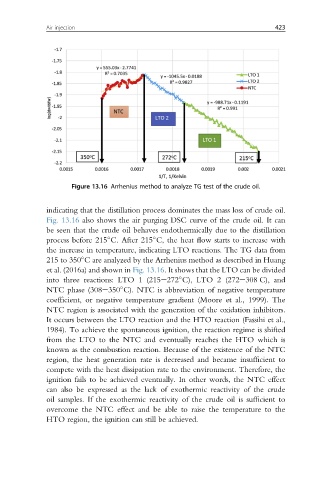
Figure 13.16 Arrhenius method to analyze TG test of the crude oil.
indicating that the distillation process dominates the mass loss of crude oil.
Fig. 13.16 also shows the air purging DSC curve of the crude oil. It can
be seen that the crude oil behaves endothermically due to the distillation
process before 215 C. After 215 C, the heat flow starts to increase with
the increase in temperature, indicating LTO reactions. The TG data from
215 to 350 C are analyzed by the Arrhenius method as described in Huang
et al. (2016a) and shown in Fig. 13.16. It shows that the LTO can be divided
into three reactions: LTO 1 (215e272 C), LTO 2 (272e308 C), and
NTC phase (308e350 C). NTC is abbreviation of negative temperature
coefficient, or negative temperature gradient (Moore et al., 1999). The
NTC region is associated with the generation of the oxidation inhibitors.
It occurs between the LTO reaction and the HTO reaction (Fassihi et al.,
1984). To achieve the spontaneous ignition, the reaction regime is shifted
from the LTO to the NTC and eventually reaches the HTO which is
known as the combustion reaction. Because of the existence of the NTC
region, the heat generation rate is decreased and became insufficient to
compete with the heat dissipation rate to the environment. Therefore, the
ignition fails to be achieved eventually. In other words, the NTC effect
can also be expressed as the lack of exothermic reactivity of the crude
oil samples. If the exothermic reactivity of the crude oil is sufficient to
overcome the NTC effect and be able to raise the temperature to the
HTO region, the ignition can still be achieved.