
Page 457 - Enhanced Oil Recovery in Shale and Tight Reservoirs
P. 457
424 Enhanced Oil Recovery in Shale and Tight Reservoirs
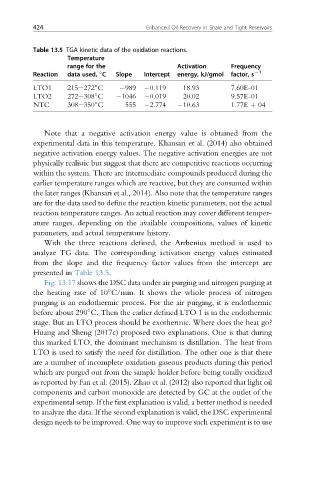
Table 13.5 TGA kinetic data of the oxidation reactions.
Temperature
range for the Activation Frequency
Reaction data used, C Slope Intercept energy, kJ/gmol factor, s L1
LTO1 215e272 C 989 0.119 18.93 7.60E-01
LTO2 272e308 C 1046 0.019 20.02 9.57E-01
NTC 308e350 C 555 2.774 10.63 1.77E þ 04
Note that a negative activation energy value is obtained from the
experimental data in this temperature. Khansari et al. (2014) also obtained
negative activation energy values. The negative activation energies are not
physically realistic but suggest that there are competitive reactions occurring
within the system. There are intermediate compounds produced during the
earlier temperature ranges which are reactive, but they are consumed within
the later ranges (Khansari et al., 2014). Also note that the temperature ranges
are for the data used to define the reaction kinetic parameters, not the actual
reaction temperature ranges. An actual reaction may cover different temper-
ature ranges, depending on the available compositions, values of kinetic
parameters, and actual temperature history.
With the three reactions defined, the Arrhenius method is used to
analyze TG data. The corresponding activation energy values estimated
from the slope and the frequency factor values from the intercept are
presented in Table 13.5.
Fig. 13.17 shows the DSC data under air purging and nitrogen purging at
the heating rate of 10 C/min. It shows the whole process of nitrogen
purging is an endothermic process. For the air purging, it is endothermic
before about 290 C. Then the earlier defined LTO 1 is in the endothermic
stage. But an LTO process should be exothermic. Where does the heat go?
Huang and Sheng (2017c) proposed two explanations. One is that during
this marked LTO, the dominant mechanism is distillation. The heat from
LTO is used to satisfy the need for distillation. The other one is that there
are a number of incomplete oxidation gaseous products during this period
which are purged out from the sample holder before being totally oxidized
as reported by Fan et al. (2015). Zhao et al. (2012) also reported that light oil
components and carbon monoxide are detected by GC at the outlet of the
experimental setup. If the first explanation is valid, a better method is needed
to analyze the data. If the second explanation is valid, the DSC experimental
design needs to be improved. One way to improve such experiment is to use