
Page 460 - Mechanical Behavior of Materials
P. 460
460 Chapter 9 Fatigue of Materials: Introduction and Stress-Based Approach
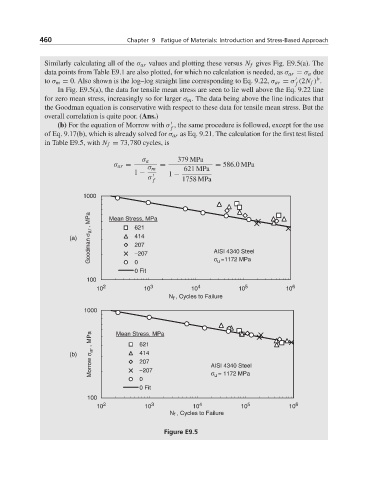
Similarly calculating all of the σ ar values and plotting these versus N f gives Fig. E9.5(a). The
data points from Table E9.1 are also plotted, for which no calculation is needed, as σ ar = σ a due
b
to σ m = 0. Also shown is the log–log straight line corresponding to Eq. 9.22, σ ar = σ (2N f ) .
f
In Fig. E9.5(a), the data for tensile mean stress are seen to lie well above the Eq. 9.22 line
for zero mean stress, increasingly so for larger σ m . The data being above the line indicates that
the Goodman equation is conservative with respect to these data for tensile mean stress. But the
overall correlation is quite poor. (Ans.)
(b) For the equation of Morrow with σ , the same procedure is followed, except for the use
f
of Eq. 9.17(b), which is already solved for σ ar as Eq. 9.21. The calculation for the first test listed
in Table E9.5, with N f = 73,780 cycles, is
σ a 379 MPa
σ ar = = = 586.0MPa
σ m 621 MPa
1 − 1 −
σ
f 1758 MPa
1000
621
414
(a) Goodman σ ar , MPa Mean Stress, MPa AISI 4340 Steel
207
−207
u
0
0 Fit σ =1172 MPa
100
10 2 10 3 10 4 10 5 10 6
N f , Cycles to Failure
1000
621
414
(b) Morrow σ ar , MPa Mean Stress, MPa AISI 4340 Steel
207
u
0 −207 σ = 1172 MPa
0 Fit
100
10 2 10 3 10 4 10 5 10 6
N f , Cycles to Failure
Figure E9.5