
Page 173 - Introduction to Statistical Pattern Recognition
P. 173
4 Parametric Classifiers 155
(X-MI)'C;'(X-M~) and d;(X) = (X-Mz)'Z5'(X-M2) are used as the x- and
y-axes respectively, and to draw the classifier boundary by using human judge-
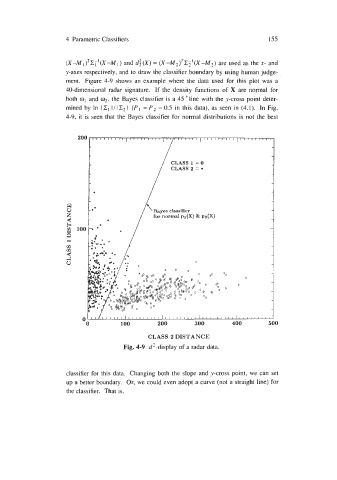
ment. Figure 4-9 shows an example where the data used for this plot was a
40-dimensional radar signature. If the density functions of X are normal for
both o1 and 6$, the Bayes classifier is a 45 line with the y-cross point deter-
mined by In I XI I / I & I (P I = P 2 = 0.5 in this data), as seen in (4.1). In Fig.
4-9, it is seen that the Bayes classifier for normal distributions is not the best
CLASS 1 =o
CLASS 2 = *
CLASS 2 DISTANCE
Fig. 4-9 d2-display of a radar data.
classifier for this data. Changing both the slope and y-cross point, we can set
up a better boundary. Or, we could even adopt a curve (not a straight line) for
the classifier. That is.