
Page 181 - Materials Chemistry, Second Edition
P. 181
3.7 Illustration of the Inventory Phase by an Example 165
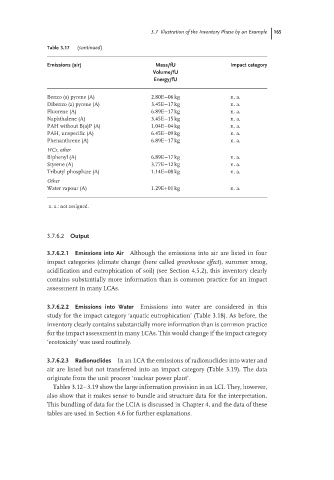
Table 3.17 (continued)
Emissions (air) Mass/fU Impact category
Volume/fU
Energy/fU
Benzo (a) pyrene (A) 2.80E−06 kg n. a.
Dibenzo (a) pyrene (A) 3.45E−17 kg n. a.
Fluorene (A) 6.89E−17 kg n. a.
Naphthalene (A) 3.45E−15 kg n. a.
PAH without B(a)P (A) 1.04E−04 kg n. a.
PAH, unspecific (A) 6.45E−09 kg n. a.
Phenanthrene (A) 6.89E−17 kg n. a.
HCs, other
Biphenyl (A) 6.89E−17 kg n. a.
Styrene (A) 3.77E−12 kg n. a.
Tributyl phosphate (A) 1.14E−08 kg n. a.
Other
Water vapour (A) 1.29E+01 kg n. a.
n. a.: not assigned.
3.7.6.2 Output
3.7.6.2.1 Emissions into Air Although the emissions into air are listed in four
impact categories (climate change (here called greenhouse effect), summer smog,
acidification and eutrophication of soil) (see Section 4.5.2), this inventory clearly
contains substantially more information than is common practice for an impact
assessment in many LCAs.
3.7.6.2.2 Emissions into Water Emissions into water are considered in this
study for the impact category ‘aquatic eutrophication’ (Table 3.18). As before, the
inventory clearly contains substantially more information than is common practice
for the impact assessment in many LCAs. This would change if the impact category
‘ecotoxicity’ was used routinely.
3.7.6.2.3 Radionuclides In an LCA the emissions of radionuclides into water and
air are listed but not transferred into an impact category (Table 3.19). The data
originate from the unit process ‘nuclear power plant’.
Tables 3.12–3.19 show the large information provision in an LCI. They, however,
also show that it makes sense to bundle and structure data for the interpretation.
This bundling of data for the LCIA is discussed in Chapter 4, and the data of these
tables are used in Section 4.6 for further explanations.