
Page 201 - Materials Chemistry, Second Edition
P. 201
4.2 Method of Critical Volumes 185
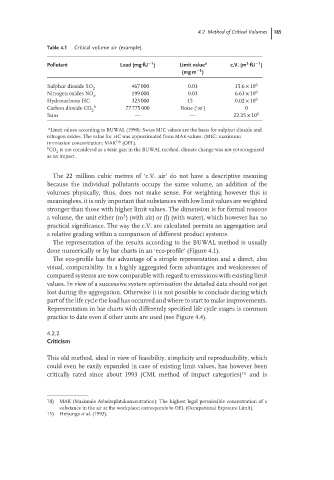
Table 4.1 Critical volume air (example).
3
−1
Pollutant Load (mg fU ) Limit value a c.V. (m fU −1 )
(mg m −3 )
Sulphur dioxide SO 2 467 000 0.03 15.6 × 10 6
Nitrogen oxides NO 199 000 0.03 6.63 × 10 6
x
Hydrocarbons HC 323 000 15 0.02 × 10 6
Carbon dioxide CO b 77 775 000 None (‘∞’) 0
2
Sum — — 22.25 × 10 6
a Limit values according to BUWAL (1990): Swiss MIC values are the basis for sulphur dioxide and
nitrogen oxides. The value for HC was approximated from MAK-values. (MIC: maximum
immission concentration; MAK 10) (OEL).
b
CO is not considered as a toxic gas; in the BUWAL method, climate change was not yet recognised
2
as an impact.
The 22 million cubic metres of ‘c.V. air’ do not have a descriptive meaning
because the individual pollutants occupy the same volume, an addition of the
volumes physically, thus, does not make sense. For weighting however this is
meaningless, it is only important that substances with low limit values are weighted
stronger than those with higher limit values. The dimension is for formal reasons
3
a volume, the unit either (m ) (with air) or (l) (with water), which however has no
practical significance. The way the c.V. are calculated permits an aggregation and
a relative grading within a comparison of different product systems.
The representation of the results according to the BUWAL method is usually
done numerically or by bar charts in an ‘eco-profile’ (Figure 4.1).
The eco-profile has the advantage of a simple representation and a direct, also
visual, comparability. In a highly aggregated form advantages and weaknesses of
compared systems are now comparable with regard to emissions with existing limit
values. In view of a successive system optimisation the detailed data should not get
lost during the aggregation. Otherwise it is not possible to conclude during which
part of the life cycle the load has occurred and where to start to make improvements.
Representation in bar charts with differently specified life cycle stages is common
practice to date even if other units are used (see Figure 4.4).
4.2.2
Criticism
This old method, ideal in view of feasibility, simplicity and reproducibility, which
could even be easily expanded in case of existing limit values, has however been
critically rated since about 1993 (CML method of impact categories) 11) and is
10) MAK (Maximale Arbeitsplatzkonzentration): The highest legal permissible concentration of a
substance in the air at the workplace; corresponds to OEL (Occupational Exposure Limit).
11) Heijungs et al. (1992).