
Page 82 - Materials Chemistry, Second Edition
P. 82
66 3 Life Cycle Inventory Analysis
Unit process 1 Unit process 2 Unit process 3 Unit process n
Unit process 4 Unit process m
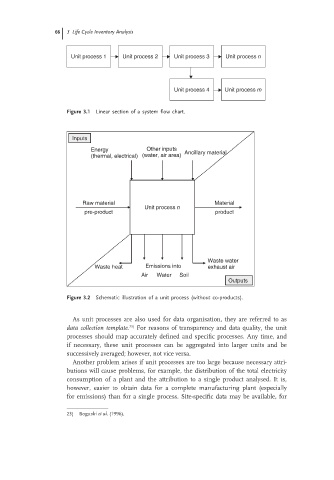
Figure 3.1 Linear section of a system flow chart.
Inputs
Energy Other inputs Ancillary material
(thermal, electrical) (water, air area)
Raw material Material
Unit process n
pre-product product
Waste water
Waste heat Emissions into exhaust air
Air Water Soil
Outputs
Figure 3.2 Schematic illustration of a unit process (without co-products).
As unit processes are also used for data organisation, they are referred to as
data collection template. 23) For reasons of transparency and data quality, the unit
processes should map accurately defined and specific processes. Any time, and
if necessary, these unit processes can be aggregated into larger units and be
successively averaged; however, not vice versa.
Another problem arises if unit processes are too large because necessary attri-
butions will cause problems, for example, the distribution of the total electricity
consumption of a plant and the attribution to a single product analysed. It is,
however, easier to obtain data for a complete manufacturing plant (especially
for emissions) than for a single process. Site-specific data may be available, for
23) Boguski et al. (1996).