
Page 258 - Materials Chemistry, Second Edition
P. 258
244 R.K. Rosenbaum et al.
200
persons 175 working point 1 working point 2
150
annual deaths per 10 5 100
125
75
50
exposure-response curve
marginal slope
25
average slope
0
0 20 40 60 80 100 120 140 160 180 200 220 240
fine par culate ma er air concentra on [μg/m³]
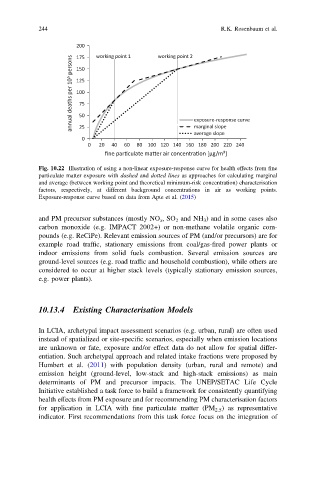
Fig. 10.22 Illustration of using a non-linear exposure-response curve for health effects from fine
particulate matter exposure with dashed and dotted lines as approaches for calculating marginal
and average (between working point and theoretical minimum-risk concentration) characterisation
factors, respectively, at different background concentrations in air as working points.
Exposure-response curve based on data from Apte et al. (2015)
and PM precursor substances (mostly NO x ,SO 2 and NH 3 ) and in some cases also
carbon monoxide (e.g. IMPACT 2002+) or non-methane volatile organic com-
pounds (e.g. ReCiPe). Relevant emission sources of PM (and/or precursors) are for
example road traffic, stationary emissions from coal/gas-fired power plants or
indoor emissions from solid fuels combustion. Several emission sources are
ground-level sources (e.g. road traffic and household combustion), while others are
considered to occur at higher stack levels (typically stationary emission sources,
e.g. power plants).
10.13.4 Existing Characterisation Models
In LCIA, archetypal impact assessment scenarios (e.g. urban, rural) are often used
instead of spatialized or site-specific scenarios, especially when emission locations
are unknown or fate, exposure and/or effect data do not allow for spatial differ-
entiation. Such archetypal approach and related intake fractions were proposed by
Humbert et al. (2011) with population density (urban, rural and remote) and
emission height (ground-level, low-stack and high-stack emissions) as main
determinants of PM and precursor impacts. The UNEP/SETAC Life Cycle
Initiative established a task force to build a framework for consistently quantifying
health effects from PM exposure and for recommending PM characterisation factors
for application in LCIA with fine particulate matter (PM 2.5 ) as representative
indicator. First recommendations from this task force focus on the integration of