
Page 217 - Moving the Earth_ The Workbook of Excavation
P. 217
DITCHING AND DEWATERING
DITCHING AND DEWATERING 5.19
Plotting Profiles. If there are no plans, or if they merely specify a gradient, the surface profile
should be drawn to scale on a sheet or strip of cross-section paper.
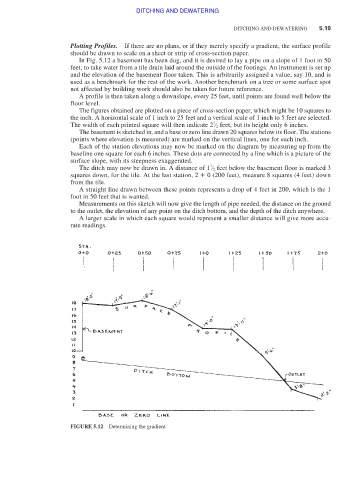
In Fig. 5.12 a basement has been dug, and it is desired to lay a pipe on a slope of 1 foot in 50
feet, to take water from a tile drain laid around the outside of the footings. An instrument is set up
and the elevation of the basement floor taken. This is arbitrarily assigned a value, say 10, and is
used as a benchmark for the rest of the work. Another benchmark on a tree or some surface spot
not affected by building work should also be taken for future reference.
A profile is then taken along a downslope, every 25 feet, until points are found well below the
floor level.
The figures obtained are plotted on a piece of cross-section paper, which might be 10 squares to
the inch. A horizontal scale of 1 inch to 25 feet and a vertical scale of 1 inch to 5 feet are selected.
1
The width of each printed square will then indicate 2 ⁄ 2 feet, but its height only 6 inches.
The basement is sketched in, and a base or zero line drawn 20 squares below its floor. The stations
(points where elevation is measured) are marked on the vertical lines, one for each inch.
Each of the station elevations may now be marked on the diagram by measuring up from the
baseline one square for each 6 inches. These dots are connected by a line which is a picture of the
surface slope, with its steepness exaggerated.
1
The ditch may now be drawn in. A distance of 1 ⁄ 2 feet below the basement floor is marked 3
squares down, for the tile. At the last station, 2 0 (200 feet), measure 8 squares (4 feet) down
from the tile.
A straight line drawn between these points represents a drop of 4 feet in 200, which is the 1
foot in 50 feet that is wanted.
Measurements on this sketch will now give the length of pipe needed, the distance on the ground
to the outlet, the elevation of any point on the ditch bottom, and the depth of the ditch anywhere.
A larger scale in which each square would represent a smaller distance will give more accu-
rate readings.
FIGURE 5.12 Determining the gradient.