
Page 228 - Moving the Earth_ The Workbook of Excavation
P. 228
DITCHING AND DEWATERING
5.30 THE WORK
The assumptions involved are not strictly accurate, as runoff increases as the ground becomes
saturated, as water penetrating the soil emerges at lower levels, and the rate of flow is more rapid
as the volume in channels becomes larger. However, there are so many variables that exact results
cannot be obtained, and the average culvert is not important enough to justify an individual study
of its drainage area.
The intensity of rainfall will determine the amount of water that will fall on an acre. The
ground, slope, and vegetation will regulate how much of that water will flow off, and the speed of
its flow. The number of acres in the watershed will determine the total amount of water delivered
to the culvert. The period of concentration will determine the length of rainfall necessary to bring
the area to the point of full discharge.
There are a number of formulas used in runoff calculations. These may give the volume of
water to be expected, or the area in square feet of the culvert or bridge opening required.
Information can also be obtained from performance of existing culverts or bridges, and observed
heights of floodwater.
The value of results obtained varies with the care with which field studies are made and with
a number of factors that are difficult to work out. However, for the contractor who wishes a gen-
eral guide to culvert size requirements, the simplest method is best.
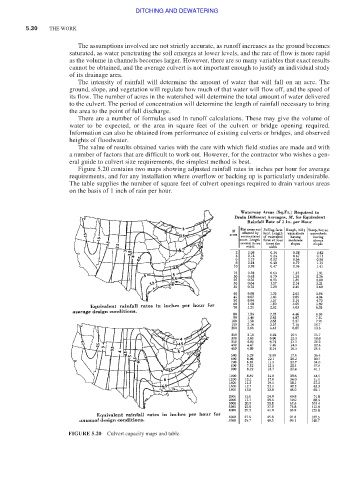
Figure 5.20 contains two maps showing adjusted rainfall rates in inches per hour for average
requirements, and for any installation where overflow or backing up is particularly undesirable.
The table supplies the number of square feet of culvert openings required to drain various areas
on the basis of 1 inch of rain per hour.
FIGURE 5.20 Culvert capacity maps and table.