
Page 116 - 3D Fibre Reinforced Polymer Composites
P. 116
Micromechanics Models for Mechanical Properties 105
and strains computed at a critical point in a yarn to predict the failure load. The Tsai-
Wu (197 1) tensor polynomial criterion may also be used to predict the yarn strength.
Failure that occurs in the matrix can be predicted using conventional failure criteria for
a homogeneous and isotropic material. Failure that occurs along the interface between
two yarns may be predicted using those failure criteria for predicting interlaminar
delamination in composite laminates.
Tan et al (2000a,b) investigated the failure of the 3D orthogonal woven composite
specimen in tensile loading. They carried out a full 3D finite element analysis of a unit
cell for the 3D orthogonal woven composite by modelling yarns as a homogeneous and
orthotropic property and matrix as being isotropic. Maximum stress criterion and the
rule of mixture were employed to predict the tensile strengths in both in-plane
directions, i.e., the stuffer yarn and weft yarn directions. A good correlation was noted
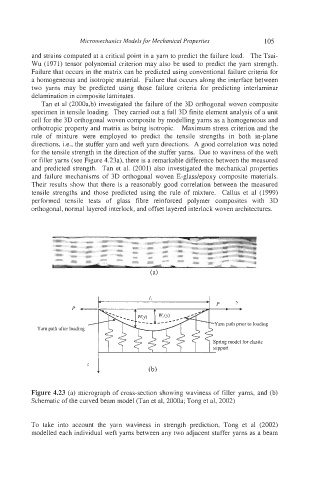
for the tensile strength in the direction of the stuffer yarns. Due to waviness of the weft
or filler yarns (see Figure 4.23a), there is a remarkable difference between the measured
and predicted strength. Tan et al. (2001) also investigated the mechanical properties
and failure mechanisms of 3D orthogonal woven E-glass/epoxy composite materials.
Their results show that there is a reasonably good correlation between the measured
tensile strengths and those predicted using the rule of mixture. Callus et a1 (1999)
performed tensile tests of glass fibre reinforced polymer composites with 3D
orthogonal, normal layered interlock, and offset layered interlock woven architectures.
<----*--- -x
path after I ?Yam path prior to loading
Spring model for elastic
z l
Figure 4.23 (a) micrograph of cross-section showing waviness of filler yarns, and (b)
Schematic of the curved beam model (Tan et al, 2000a; Tong et al, 2002)
To take into account the yarn waviness in strength prediction, Tong et a1 (2002)
modelled each individual weft yarns between any two adjacent stuffer yarns as a beam