
Page 13 - A Comprehensive Guide to Solar Energy Systems
P. 13
Chapter 1 • Why Solar Energy? 5
1.2 How Much Solar Energy Falls on the Earth and How
Much is Used to Make Electricity?
There are many ways of expressing how much solar energy falls on the earth. Chris Goodall
writes in The Switch that the sun supplies enough power in 90 min to meet the world’s total
15
energy needs for a year [6]. In more scientific language, the Earth receives 174 × 10 W
[174 PW (petawatts)] of incoming solar radiation (insolation) at the upper atmosphere.
Approximately 30% of this is reflected back to space, while the rest is absorbed by the
oceans and landmasses and things on the earth. At night this 70% absorbed energy is radi-
ated back into space keeping the earth at a constant temperature.
The total solar energy absorbed by the Earth’s atmosphere, oceans, and land masses is
−1
approximately 3.85 × 10 J a [3.85 yJ a (yottajoules per annum)] [7]. Photosynthesis
24
−1
−1
captures less than 0.1% of this, approximately 3.0 × 10 ZJ a (zettajoules per annum), in
21
biomass [8]. The total energy consumption in the world today is less than 0.02% of the total
solar energy shining on the earth.
Most people in the world live in areas with insolation levels of 150–300 W m or 3.5–
−2
7.0 kW h m d , where d refers to day [9]. This magnitude of solar energy available makes
–2
–1
it an appealing source of electricity. The United Nations development Programme in its
2000 World Energy Assessment found that the annual potential of solar energy was be-
tween 16 000 and 50 000 × 10 J (16 000–50 000 EJ). This is many times larger than the total
18
world energy consumption, which was 559.8 EJ in 2012 [10].
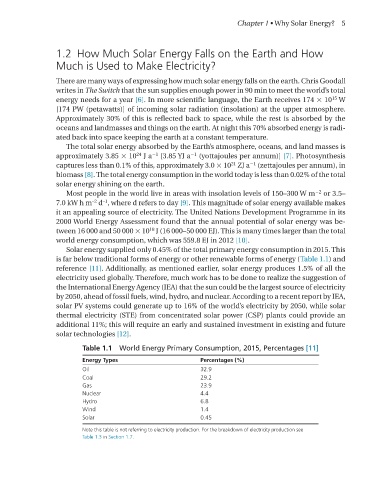
Solar energy supplied only 0.45% of the total primary energy consumption in 2015. This
is far below traditional forms of energy or other renewable forms of energy (Table 1.1) and
reference [11]. Additionally, as mentioned earlier, solar energy produces 1.5% of all the
electricity used globally. Therefore, much work has to be done to realize the suggestion of
the International Energy Agency (IEA) that the sun could be the largest source of electricity
by 2050, ahead of fossil fuels, wind, hydro, and nuclear. According to a recent report by IEA,
solar PV systems could generate up to 16% of the world’s electricity by 2050, while solar
thermal electricity (STE) from concentrated solar power (CSP) plants could provide an
additional 11%; this will require an early and sustained investment in existing and future
solar technologies [12].
Table 1.1 World Energy Primary Consumption, 2015, Percentages [11]
Energy Types Percentages (%)
Oil 32.9
Coal 29.2
Gas 23.9
Nuclear 4.4
Hydro 6.8
Wind 1.4
Solar 0.45
Note this table is not referring to electricity production. For the breakdown of electricity production see
Table 1.3 in Section 1.7.