Page 63 - A Guide to MATLAB for Beginners and Experienced Users
P. 63

44        Chapter 3: Interacting with MATLAB


                       % Remove old graphics, and get ready for several new ones.
                       close all; axes; hold on


                       % Run a loop to plot three sine curves.
                       for c = 1:3
                           plot(x, sin(c*x))
                           echo off
                       end
                       echo on
                       hold off


                       % Put a title on the figure.
                       title(’Several Sine Curves’)
                       pause

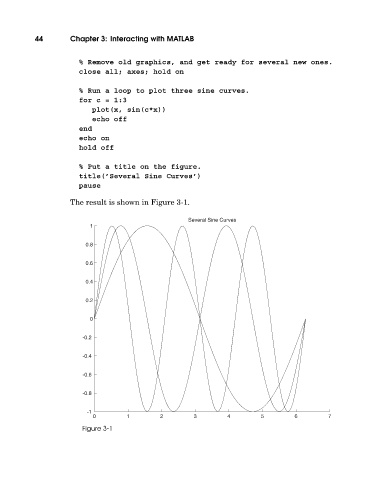
                     The result is shown in Figure 3-1.

                                                     Several Sine Curves
                          1

                         0.8

                         0.6

                         0.4

                         0.2


                          0

                        -0.2

                        -0.4

                        -0.6

                        -0.8


                         -1
                           0        1        2         3        4        5        6        7
                        Figure 3-1
   58   59   60   61   62   63   64   65   66   67   68