
Page 38 - A Practical Companion to Reservoir Stimulation
P. 38
ROCK MECHANICS
EXAMPLE B-7
plane formed by the vertical and the two horizontal axes. The
Failure Envelope and Wellbore Stability
controlling plane of stress is the one formed by the minimum
horizontal stress (the smallest of the three) and the vertical
A series of laboratory tests was performed on a typical stress (the largest of the three). These two describe the con-
reservoir sandstone. The tests and data are shown in Table trolling Mohr circle.
B-4. As can be easily concluded, the Mohr circle describing the
Contemplating a completion at 10,000 ft, microhydraulic well, being well within the failure envelope, implies a stable
fracturing tests were conducted and revealed an in-situ stress wellbore.
condition described as: If th,e well is to be used as an injector, the increase in the
pore pressure will result in a proportional decrease of the
3800
0, = 1 1,000 psi, o~,,~~;,, psi, and o~,,~,, 7200 psi. effective stresses. Since the stresses on the failure envelope
=
=
are effective, the Mohr circle describing the well will move to
Assuming this is a dry hole, will the borehole be stable? If this the left. This shift, until the well Mohr circle touches the
borehole is to be used as an “injection” well, ;hat is the failure envelope, is the maximum tolerable value for the
maximum injection pressure that can be tolerated? If the well injection pressure to avoid wellbore collapse. The pressure
will be hydraulically fractured, will it collapse before it shift (from Fig. B-5) is approximately 5200 psi, which is also
reaches tensile failure? the maximum allowable injection pressure.
Solution (Ref. Section 2-3) If the well is to be hydraulically fractured, then from Eq.
At first, Mohr circles are drawn, and a typical failure envelope 2-SO (and assuming p = 0),
= 3 (3800) - 7200 + 1600
diagram as shown by Fig. 2-9 is constructed. Effective stresses ~h~~,~~kd~,,,.,~
are drawn, and therefore, whenever pore pressures are indi- = 5800psi. (B-24)
cated in Table B-4, these values are subtracted from the
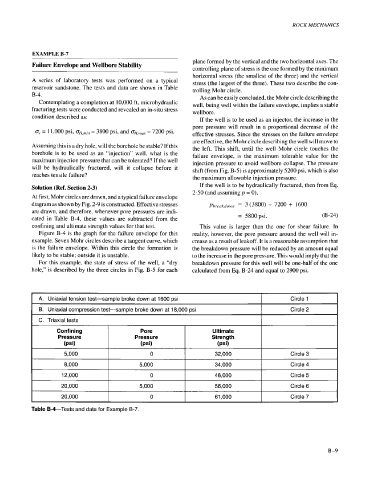
confining and ultimate strength values for that test. This value is larger than the one for shear failure. In
Figure B-4 is the graph for the failure envelope for this reality, however, the pore pressure around the well will in-
example. Seven Mohr circles describe a tangent curve, which crease as a result of leakoff. It is a reasonable assumption that
is the failure envelope. Within this circle the formation is the breakdown pressure will be reduced by an amount equal
likely to be stable; outside it is unstable. to the increase in the pore pressure. This would imply that the
For this example, the state of stress of the well, a “dry breakdown pressure for this well will be one-half of the one
hole,” is described by the three circles in Fig. B-5 for each calculated from Eq. B-24 and equal to 2900 psi.
A. Uniaxial tension test-sample broke down at 1600 psi Circle 1
B. Uniaxial compression test-sample broke down at 18,000 psi Circle 2
C. Triaxial tests I
Confining Pore Ultimate
Pressure Pressure Strength
(Psi) (Psi) (Psi)
5,000 I 0 I 32,000 I Circle 3
8,000 I 5,000 I 34,000 I Circle 4
12,000 I 0 I 46,000 I Circle 5
20,000 5,000 56,000 Circle 6
20,000 0 61,000 Circle 7
Table B-&Tests and data for Example B-7.
B-9