
Page 67 - A Working Method Approach For Introductory Physical Chemistry Calculations
P. 67
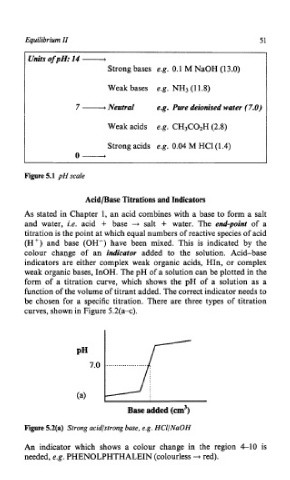
Units ofpH: 14 -
       Equilibrium II                                            51


                            Strong bases  e.g. 0.1 M NaOH (13.0)

                            Weak bases  e.g. NH3 (1 1.8)

                    7 - Neutral         e.g.  Pure deionised water (7.0)

                            Weak acids   e.g. CH3C02H (2.8)

                            Strong acids  e.g. 0.04 M HCl(l.4)
                    0-

       Figure 5.1 pH scale


                      Acid/Base Titrations and Indicators
       As stated in Chapter  1, an acid combines with a base to form a salt
       and  water,  i.e. acid  +  base  -+  salt  +  water.  The  end-point  of  a
       titration is the point at which equal numbers of reactive species of acid
       (H+) and  base  (OH-)  have  been  mixed.  This  is  indicated  by  the
       colour  chavge  of  an  indicator  added  to  the  solution.  Acid-base
       indicators  are either  complex weak  organic  acids, HIn, or complex
       weak organic bases, InOH. The pH of a solution can be plotted in the
       form  of  a  titration  curve,  which  shows the  pH  of  a  solution  as  a
       function of the volume of titrant added. The correct indicator needs to
       be  chosen  for  a  specific titration.  There are three  types of  titration
       curves, shown in Figure 5.2(a-c).


                             -
                       7.0 .__ _. _._.. .._ ._ ___.


                                 Base added (cm3)

       Figure 5.2(a)  Strong acidlstrong base, e.g. HCllNaOH
       An  indicator  which  shows  a  colour  change  in  the  region  4-10  is
       needed, e.g. PHENOLPHTHALEIN (colourless + red).