
Page 189 - Accounting Best Practices
P. 189
c09.qxd 7/31/03 3:08 PM Page 178
Costing Best Practices
178
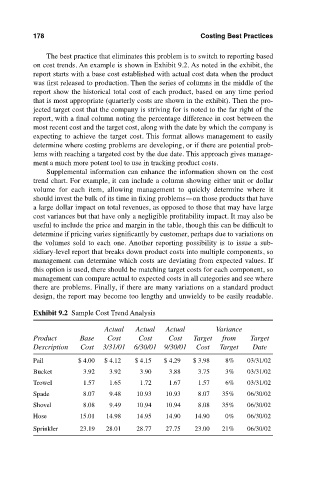
The best practice that eliminates this problem is to switch to reporting based
on cost trends. An example is shown in Exhibit 9.2. As noted in the exhibit, the
report starts with a base cost established with actual cost data when the product
was first released to production. Then the series of columns in the middle of the
report show the historical total cost of each product, based on any time period
that is most appropriate (quarterly costs are shown in the exhibit). Then the pro-
jected target cost that the company is striving for is noted to the far right of the
report, with a final column noting the percentage difference in cost between the
most recent cost and the target cost, along with the date by which the company is
expecting to achieve the target cost. This format allows management to easily
determine where costing problems are developing, or if there are potential prob-
lems with reaching a targeted cost by the due date. This approach gives manage-
ment a much more potent tool to use in tracking product costs.
Supplemental information can enhance the information shown on the cost
trend chart. For example, it can include a column showing either unit or dollar
volume for each item, allowing management to quickly determine where it
should invest the bulk of its time in fixing problems—on those products that have
a large dollar impact on total revenues, as opposed to those that may have large
cost variances but that have only a negligible profitability impact. It may also be
useful to include the price and margin in the table, though this can be difficult to
determine if pricing varies significantly by customer, perhaps due to variations on
the volumes sold to each one. Another reporting possibility is to issue a sub-
sidiary-level report that breaks down product costs into multiple components, so
management can determine which costs are deviating from expected values. If
this option is used, there should be matching target costs for each component, so
management can compare actual to expected costs in all categories and see where
there are problems. Finally, if there are many variations on a standard product
design, the report may become too lengthy and unwieldy to be easily readable.
Exhibit 9.2 Sample Cost Trend Analysis
Actual Actual Actual Variance
Product Base Cost Cost Cost Target from Target
Description Cost 3/31/01 6/30/01 9/30/01 Cost Target Date
Pail $ 4.00 $ 4.12 $ 4.15 $ 4.29 $ 3.98 8% 03/31/02
Bucket 3.92 3.92 3.90 3.88 3.75 3% 03/31/02
Trowel 1.57 1.65 1.72 1.67 1.57 6% 03/31/02
Spade 8.07 9.48 10.93 10.93 8.07 35% 06/30/02
Shovel 8.08 9.49 10.94 10.94 8.08 35% 06/30/02
Hose 15.01 14.98 14.95 14.90 14.90 0% 06/30/02
Sprinkler 23.19 28.01 28.77 27.75 23.00 21% 06/30/02