
Page 170 - Adsorption by Powders and Porous Solids
P. 170
ADSORPTION BY POWDERS AND ~OROUS SOLID^ 1
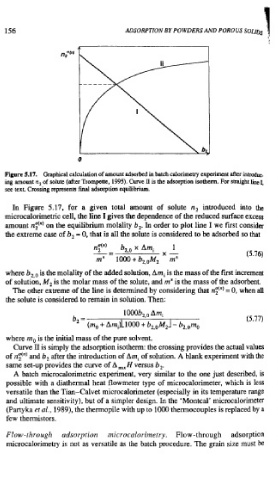
Figure 5.17. Graphical calculation of amount adsorbed in batch calorimetry experiment after introduC.
ing amount n, of solute (after Trompette, 1995). Curve I. is the adsorption isotherm. For straight Line 1,
see text. Crossing represents final adsorption equilibrium.
In Figure 5.17, for a given total amount of solute n, introduced into the
microcalorimetric cell, the line I gives the dependence of the reduced surface excess
amount n$") on the equilibrium molality b,. In order to plot line I we first consider
the extreme case of b, = 0, that is all the solute is considered to be adsorbed so that
where b,,, is the molality of the added solution, Ami is the mass of the first increment
of solution, M, is the molar mass of the solute, and mYs the mass of the adsorbent.
The other extreme of the line is determined by considering that nz'") = 0, when all
the solute is considered to remain in solution. Then:
where m, is the initial mass of the pure solvent.
Curve I1 is simply the adsorption isotherm: the crossing provides the actual values
of n$"' and b, after the introduction of Am, of solution. A blank experiment with the
same set-up provides the curve of A ,, H versus b,.
A batch microcalorimetric experiment, very similar to the one just described, is
possible with a diathermal heat flowmeter type of microcalorimeter, which is less
versatile than the Tian-Calvet microcalorimeter (especially in its temperature range
and ultimate sensitivity), but of a simpler design. In the 'Montcal' microcalorimeter
(Partyka et al., 1989), the thermopile with up to 1000 thermocouples is replaced by a
few thermistors.
Flow-through adsorption microcalorimetry. Flow-through adsorption
microcalorimetry is not as versatile as the batch procedure. The grain size must be