
Page 247 - Adsorption Technology & Design, Elsevier (1998)
P. 247
224 Selected adsorption processes
4.0
Case fructose glucose
++ ,,
Fructose
i 2 r7
iil:
;i! a o
~i',, 4 +
I! +
'hi
I
I 1
I t
':~
I '
!;
t I i
' l
I, I
t !
' I
1.0
Glucose
i I I
; P
i I 1
E
II
o
II ~.4
o
l;
I;
,i/3
o
I !
:,,.,.
! !
, i/! ., CC
!
0.4
i i ] "
; i I / "
I
I # : II ;
i t t
c~!/\
(fructose) i :X
(glucose)
! ! #
! ! I
I I
! ," /
; I
'll
I I
I I
I ! !
.. I I ti I ..
.
I!// I ..
.
0.1
1 O0 120 140 160
0 20 40 60 80
R
0 E F
Stage number
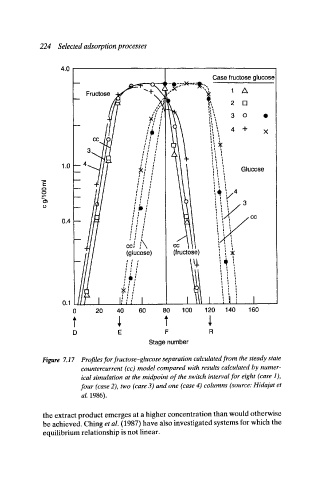
Figure 7.17 Profiles for fructose-glucose separation calculated from the steady state
countercurrent (cc) model compared with results calculated by numer-
ical simulation at the midpoint of the switch interval for eight (case 1),
four (case 2), two (case 3) and one (case 4) columns (source: Hidajat et
al. 1986).
the extract product emerges at a higher concentration than would otherwise
be achieved. Ching et al. (1987) have also investigated systems for which the
equilibrium relationship is not linear.