
Page 229 - Adsorption, Ion Exchange & Catalysis- 2007, Elsevier - Copy
P. 229
Else_AIEC-INGLE_cH003.qxd 7/13/2006 1:46 PM Page 225
3.8 T Fluid–Solid Fluidized Bed Reactors w o-Phase, 225
If a fluidized and a fed bed are operated at the same ix Re p , the mass transfer coef icient f
ix
we
,
er
is higher in the latter. Ho the fed bed can be operated only in dow mode, wnflo
v
because the solids would be entrained in upflow, at high Re ynolds numbers. Re p should be
lower than the value of 1.8 times the minimum Re p for fluidization to avoid excessive attri-
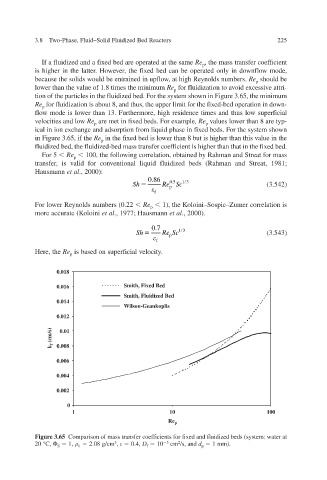
tion of the particles in the fluidized bed. For the system shown in Figure 3.65, the minimum
Re p for fluidization is about 8, and thus, the upper limit for the fixed-bed operation in down-
flow mode is lower than 13. Furthermore, high residence times and thus low superf icial
velocities and low Re p are met in fixed beds. For example, Re p values lower than 8 are typ-
ical in ion exchange and adsorption from liquid phase in fixed beds. For the system shown
in Figure 3.65, if the Re p in the fixed bed is lower than 8 but is higher than this value in the
fluidized bed, the fluidized-bed mass transfer coefficient is higher than that in the fixed bed.
For 5 Re p 100, the follo obtained by Rahman and Streat for mass wing correlation,
v
transfer, is valid for conentional liquid fluidized beds (Rahman and Streat, 1981;
Hausmann et al ., 2000):
0.86 0.5 1 3
Sh Re Sc (3.542)
p
f
For lower Reynolds numbers (0.22 Re p 1), the Koloini–Sospic–Zumer correlation is
oloini more accurate (K et al ., 1977; Hausmann et al ., 2000).
0.7 13
Sh Re Sc (3.543)
p
f
Here, the Re p is based on superficial v. elocity
0.018
0.016 Smith, Fixed Bed
Smith, Fluidized Bed
0.014
Wilson-Geankoplis
0.012
0.01
f (cm/s)
0.008 k
0.006
0.004
0.002
0
1 10 100
Re p
Figure 3.65 Comparison of mass transfer coefficients for fixed and fluidized beds (system: w ater at
20 °C, 1, 2.08 g/cm 3 , 0.4, D 10 5 cm 2 /s, and d 1 mm).
S h f p