
Page 256 - Advanced_Engineering_Mathematics o'neil
P. 256
236 CHAPTER 7 Matrices and Linear Systems
y
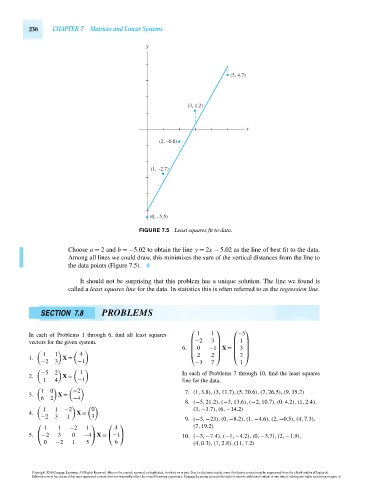
(5, 4.7)
(3, 1.2)
x
(2, –0.8)
(1, –2.7)
(0, –5.5)
FIGURE 7.5 Least squares fit to data.
Choose a = 2 and b =−5.02 to obtain the line y = 2x − 5.02 as the line of best fit to the data.
Among all lines we could draw, this minimizes the sum of the vertical distances from the line to
the data points (Figure 7.5).
It should not be surprising that this problem has a unique solution. The line we found is
called a least squares line for the data. In statistics this is often referred to as the regression line.
SECTION 7.8 PROBLEMS
⎛ ⎞ ⎛ ⎞
In each of Problems 1 through 6, find all least squares 1 1 −5
vectors for the given system. ⎜ −2 3 ⎟ ⎜ 1 ⎟
⎜ ⎜ ⎟
⎟
6. ⎜ 0 −1 X = ⎜ 3 ⎟
⎟
⎜ ⎟ ⎜ ⎟
1 1 4 ⎝ 2 ⎝ 2 ⎠
1. X = 2 ⎠
−2 3 −1 −3 7 1
−5 2 1 In each of Problems 7 through 10, find the least squares
2. X =
1 4 −1 line for the data.
1 0 −2 7. (1,3.8),(3,11.7),(5,20.6),(7,26.5),(9,35.2)
3. X =
6 2 −4
8. (−5,21.2),(−3,13.6),(−2,10.7),(0,4.2),(1,2.4),
1 1 −2 0 (3,−3.7),(6,−14.2)
4. X =
−2 3 1 3
9. (−3,−23),(0,−8.2),(1,−4.6),(2,−0.5),(4,7.3),
⎛ ⎞ ⎛ ⎞ (7,19.2)
1 1 −2 1 4
5. ⎝ −2 3 0 −4 ⎠ X = ⎝−1⎠ 10. (−3,−7.4),(−1,−4.2),(0,−3.7),(2,−1.9),
0 −2 1 5 6 (4,0.3),(7,2.8),(11,7.2)
Copyright 2010 Cengage Learning. All Rights Reserved. May not be copied, scanned, or duplicated, in whole or in part. Due to electronic rights, some third party content may be suppressed from the eBook and/or eChapter(s).
Editorial review has deemed that any suppressed content does not materially affect the overall learning experience. Cengage Learning reserves the right to remove additional content at any time if subsequent rights restrictions require it.
October 14, 2010 14:23 THM/NEIL Page-236 27410_07_ch07_p187-246