
Page 157 - Advanced Thermodynamics for Engineers, Second Edition
P. 157
144 CHAPTER 7 GENERAL THERMODYNAMIC RELATIONSHIPS
vp vs
¼ (7.19c)
vT v vv T
vv vs
¼ (7.19d)
vT vp
p T
Equations (7.19) are called the Maxwell relationships.
7.1.1 GRAPHICAL INTERPRETATION OF MAXWELL RELATIONS
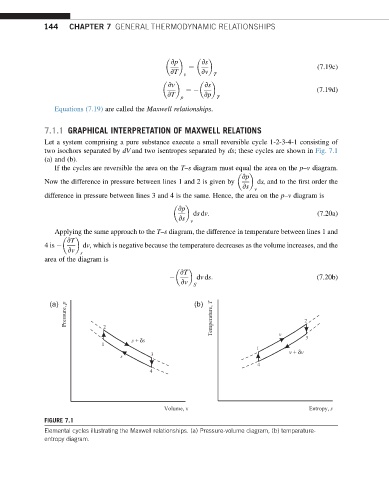
Let a system comprising a pure substance execute a small reversible cycle 1-2-3-4-1 consisting of
two isochors separated by dV and two isentropes separated by ds; these cycles are shown in Fig. 7.1
(a) and (b).
If the cycles are reversible the area on the T–s diagram must equal the area on the p–v diagram.
vp
Now the difference in pressure between lines 1 and 2 is given by ds, and to the first order the
vs
v
difference in pressure between lines 3 and 4 is the same. Hence, the area on the p–v diagram is
vp
ds dv: (7.20a)
vs v
Applying the same approach to the T–s diagram, the difference in temperature between lines 1 and
vT
4is dv, which is negative because the temperature decreases as the volume increases, and the
vv
s
area of the diagram is
vT
dv ds: (7.20b)
vv
S
(a) (b)
Pressure, p 2 Temperature, T 2
s + δs v 3
1
1 v + δv
s 3
4
4
Volume, v Entropy, s
FIGURE 7.1
Elemental cycles illustrating the Maxwell relationships. (a) Pressure-volume diagram, (b) temperature-
entropy diagram.