
Page 151 - Advances In Productive, Safe, and Responsible Coal Mining
P. 151
Communication and tracking system performance 135
portions is directed inby on the secondary EW, covering approaches to the SCSR
cache and the associated BCN there; and the other 25% power portion antenna is
placed in the belt entry enhancing coverage there, with the strategic area BCN located
at the belt head.
The inby-most portion of the tracking test area has two FMNs at offsets in entry
alignment resulting from change in pillar dimensions. These locations allow antenna
placement that should assure signal past these offset corners. The inby-pointed anten-
nas of these FMNs are estimated to extend coverage to well over 5000ft inby the portal
on both EWs.
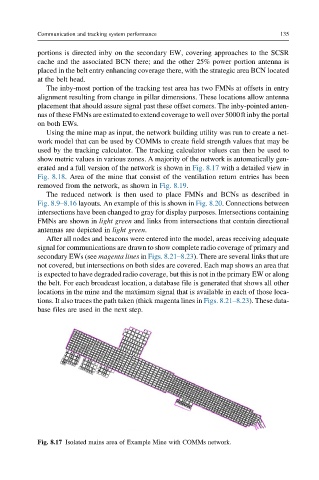
Using the mine map as input, the network building utility was run to create a net-
work model that can be used by COMMs to create field strength values that may be
used by the tracking calculator. The tracking calculator values can then be used to
show metric values in various zones. A majority of the network is automatically gen-
erated and a full version of the network is shown in Fig. 8.17 with a detailed view in
Fig. 8.18. Area of the mine that consist of the ventilation return entries has been
removed from the network, as shown in Fig. 8.19.
The reduced network is then used to place FMNs and BCNs as described in
Fig. 8.9–8.16 layouts. An example of this is shown in Fig. 8.20. Connections between
intersections have been changed to gray for display purposes. Intersections containing
FMNs are shown in light green and links from intersections that contain directional
antennas are depicted in light green.
After all nodes and beacons were entered into the model, areas receiving adequate
signal for communications are drawn to show complete radio coverage of primary and
secondary EWs (see magenta lines in Figs. 8.21–8.23). There are several links that are
not covered, but intersections on both sides are covered. Each map shows an area that
is expected to have degraded radio coverage, but this is not in the primary EW or along
the belt. For each broadcast location, a database file is generated that shows all other
locations in the mine and the maximum signal that is available in each of those loca-
tions. It also traces the path taken (thick magenta lines in Figs. 8.21–8.23). These data-
base files are used in the next step.
Fig. 8.17 Isolated mains area of Example Mine with COMMs network.