
Page 339 - Advances in Textile Biotechnology
P. 339
320 Advances in textile biotechnology
The highest degradation rate is observed for viscose. This can be attrib-
uted to several fibre properties which favour sorption and access of cellu-
lases. As shown in Table 13.1, viscose fibres show the highest expansion in
−1
the wet state, resulting in water retention values of 0.88–0.89 ml g ; thus in
the wet state, the fibre structure is highly expanded and reactive. Further-
more, owing to their multi-lobal shape, viscose fibres offer the highest fi bre
surface for protein sorption. As the molecular size of proteins prevents their
access into the pore system inside the cellulose fibres, the effective fi bre
surface influences directly the degradation rate. Owing to their oval cross
section, lyocell and modal fibres offer substantially lower surface for cel-
lulase adsorption and, as a result, lower degradation rates are observed. The
pore surface determined by ISEC (Table 13.1) is of minor infl uence on the
degradation rate as cellulases are too big to access the small pores inside
the fi bres.
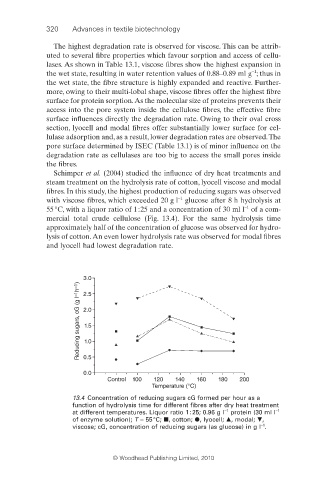
Schimper et al. (2004) studied the influence of dry heat treatments and
steam treatment on the hydrolysis rate of cotton, lyocell viscose and modal
fibres. In this study, the highest production of reducing sugars was observed
−1
with viscose fibres, which exceeded 20 g l glucose after 8 h hydrolysis at
−1
55 °C, with a liquor ratio of 1 : 25 and a concentration of 30 ml l of a com-
mercial total crude cellulose (Fig. 13.4). For the same hydrolysis time
approximately half of the concentration of glucose was observed for hydro-
lysis of cotton. An even lower hydrolysis rate was observed for modal fi bres
and lyocell had lowest degradation rate.
3.0
Reducing sugars, cG (g l –1 h –1 ) 2.0
2.5
1.5
1.0
0.5
0.0
Control 100 120 140 160 180 200
Temperature (°C)
13.4 Concentration of reducing sugars cG formed per hour as a
function of hydrolysis time for different fibres after dry heat treatment
−1
−1
at different temperatures. Liquor ratio 1 : 25; 0.96 g l protein (30 ml l
of enzyme solution); T = 55 °C; , cotton; , lyocell; , modal; ,
−1
viscose; cG, concentration of reducing sugars (as glucose) in g l .
© Woodhead Publishing Limited, 2010