
Page 185 - Aircraft Stuctures for Engineering Student
P. 185
6.6 Buckling of thin plates 169
from which
42 EI EI
PCR = - 2.471 -
=
1 712 12
This value of critical load compares with the exact value (see Table 6.1) of
7r2EI/412 = 2.467EI/12; the error, in this case, is seen to be extremely small.
Approximate values of critical load obtained by the energy method are always greater
than the correct values. The explanation lies in the fact that an assumed deflected
shape implies the application of constraints in order to force the column to take up
an artificial shape. This, as we have seen, has the effect of stiffening the column
with a consequent increase in critical load.
It will be observed that the solution for the above example may be obtained by
simply equating the increase in internal energy (U) to the work done by the external
critical load (- V). This is always the case when the assumed deflected shape contains
a single unknown coefficient, such as vo in the above example.
.
-,-%%I.- .I ,--+=-. m--~.?..-7.-*-w. r
hin plates
A thin plate may buckle in a variety of modes depending upon its dimensions, the
loading and the method of support. Usually, however, buckling loads are much
lower than those likely to cause failure in the material of the plate. The simplest
form of buckling arises when compressive loads are applied to simply supported
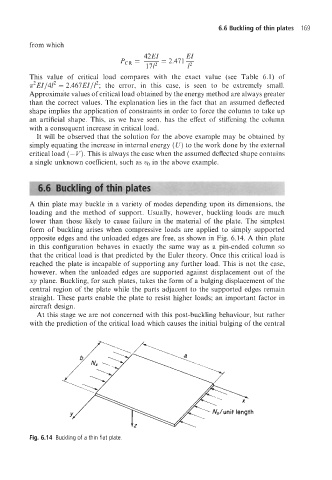
opposite edges and the unloaded edges are free, as shown in Fig. 6.14. A thin plate
in this configuration behaves in exactly the same way as a pin-ended column so
that the critical load is that predicted by the Euler theory. Once this critical load is
reached the plate is incapable of supporting any further load. This is not the case,
however, when the unloaded edges are supported against displacement out of the
xy plane. Buckling, for such plates, takes the form of a bulging displacement of the
central region of the plate while the parts adjacent to the supported edges remain
straight. These parts enable the plate to resist higher loads; an important factor in
aircraft design.
At this stage we are not concerned with this post-buckling behaviour, but rather
with the prediction of the critical load which causes the initial bulging of the central
Fig. 6.14 Buckling of a thin flat plate.