
Page 94 - Algorithm Collections for Digital Signal Processing Applications using MATLAB
P. 94
82 Chapter 2
Figure 2-5. Data and the final centroids obtained using Fuzzy k-means algorithm
In the above mentioned example data ranges from 0.0099 to 0.9883.
The final centroids obtained after 10 iteration using fuzzy k-means
algorithm is displayed below 0.0313 0.2188 0.3927 0.5317 0.6977
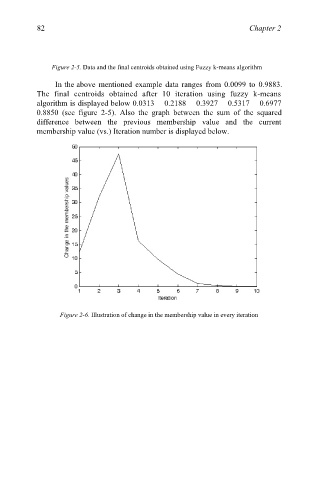
0.8850 (see figure 2-5). Also the graph between the sum of the squared
difference between the previous membership value and the current
membership value (vs.) Iteration number is displayed below.
Figure 2-6. Illustration of change in the membership value in every iteration