
Page 171 - Alternative Energy Systems in Building Design
P. 171
ECONOMICS OF SOLAR POWER SYSTEMS 147
6000000
5000000
POUNDS OF POLLUTION 4000000
3000000
2000000
1000000
0
1 2 3 4 5 6 7 8 910 11 12 13 14 15 16 17 18 19 20
PER 10K SF OF AREA
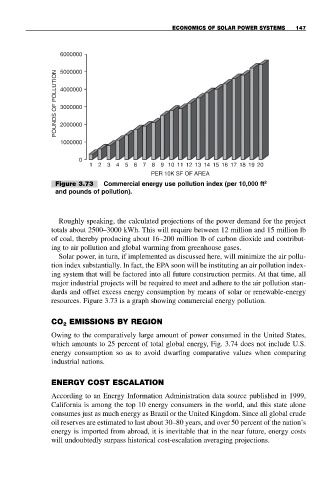
Figure 3.73 Commercial energy use pollution index (per 10,000 ft 2
and pounds of pollution).
Roughly speaking, the calculated projections of the power demand for the project
totals about 2500–3000 kWh. This will require between 12 million and 15 million lb
of coal, thereby producing about 16–200 million lb of carbon dioxide and contribut-
ing to air pollution and global warming from greenhouse gases.
Solar power, in turn, if implemented as discussed here, will minimize the air pollu-
tion index substantially. In fact, the EPA soon will be instituting an air pollution index-
ing system that will be factored into all future construction permits. At that time, all
major industrial projects will be required to meet and adhere to the air pollution stan-
dards and offset excess energy consumption by means of solar or renewable-energy
resources. Figure 3.73 is a graph showing commercial energy pollution.
CO EMISSIONS BY REGION
2
Owing to the comparatively large amount of power consumed in the United States,
which amounts to 25 percent of total global energy, Fig. 3.74 does not include U.S.
energy consumption so as to avoid dwarfing comparative values when comparing
industrial nations.
ENERGY COST ESCALATION
According to an Energy Information Administration data source published in 1999,
California is among the top 10 energy consumers in the world, and this state alone
consumes just as much energy as Brazil or the United Kingdom. Since all global crude
oil reserves are estimated to last about 30–80 years, and over 50 percent of the nation’s
energy is imported from abroad, it is inevitable that in the near future, energy costs
will undoubtedly surpass historical cost-escalation averaging projections.