
Page 157 - An Introduction To Predictive Maintenance
P. 157
Vibration Monitoring and Analysis 147
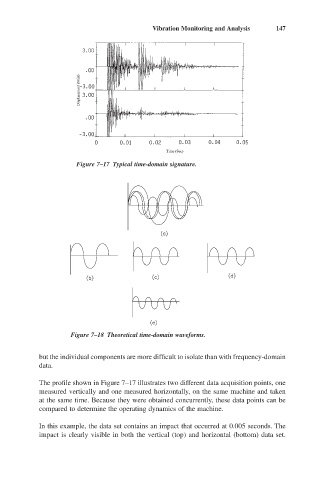
Figure 7–17 Typical time-domain signature.
Figure 7–18 Theoretical time-domain waveforms.
but the individual components are more difficult to isolate than with frequency-domain
data.
The profile shown in Figure 7–17 illustrates two different data acquisition points, one
measured vertically and one measured horizontally, on the same machine and taken
at the same time. Because they were obtained concurrently, these data points can be
compared to determine the operating dynamics of the machine.
In this example, the data set contains an impact that occurred at 0.005 seconds. The
impact is clearly visible in both the vertical (top) and horizontal (bottom) data set.