
Page 36 - An Introduction To Predictive Maintenance
P. 36
26 An Introduction to Predictive Maintenance
(-ve)
Aggregated cost
Cash outflow
( ) S
Heavy cash outflow
during downtime
and repair
Costs of single breakdowns Continuing cash outflow
during recovery
0
0
Time/usage (hours)
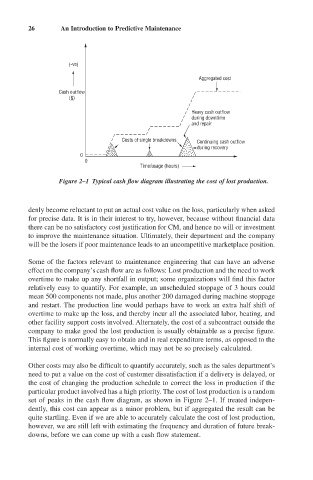
Figure 2–1 Typical cash flow diagram illustrating the cost of lost production.
denly become reluctant to put an actual cost value on the loss, particularly when asked
for precise data. It is in their interest to try, however, because without financial data
there can be no satisfactory cost justification for CM, and hence no will or investment
to improve the maintenance situation. Ultimately, their department and the company
will be the losers if poor maintenance leads to an uncompetitive marketplace position.
Some of the factors relevant to maintenance engineering that can have an adverse
effect on the company’s cash flow are as follows: Lost production and the need to work
overtime to make up any shortfall in output; some organizations will find this factor
relatively easy to quantify. For example, an unscheduled stoppage of 3 hours could
mean 500 components not made, plus another 200 damaged during machine stoppage
and restart. The production line would perhaps have to work an extra half shift of
overtime to make up the loss, and thereby incur all the associated labor, heating, and
other facility support costs involved. Alternately, the cost of a subcontract outside the
company to make good the lost production is usually obtainable as a precise figure.
This figure is normally easy to obtain and in real expenditure terms, as opposed to the
internal cost of working overtime, which may not be so precisely calculated.
Other costs may also be difficult to quantify accurately, such as the sales department’s
need to put a value on the cost of customer dissatisfaction if a delivery is delayed, or
the cost of changing the production schedule to correct the loss in production if the
particular product involved has a high priority. The cost of lost production is a random
set of peaks in the cash flow diagram, as shown in Figure 2–1. If treated indepen-
dently, this cost can appear as a minor problem, but if aggregated the result can be
quite startling. Even if we are able to accurately calculate the cost of lost production,
however, we are still left with estimating the frequency and duration of future break-
downs, before we can come up with a cash flow statement.