
Page 51 - An Introduction To Predictive Maintenance
P. 51
Financial Implications and Cost Justification 41
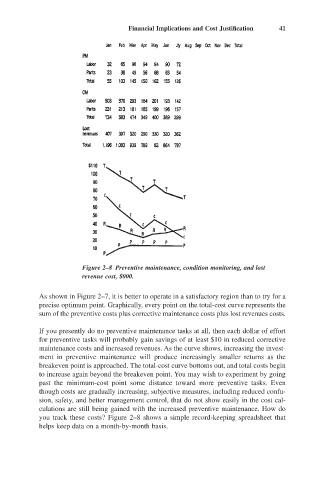
Figure 2–8 Preventive maintenance, condition monitoring, and lost
revenue cost, $000.
As shown in Figure 2–7, it is better to operate in a satisfactory region than to try for a
precise optimum point. Graphically, every point on the total-cost curve represents the
sum of the preventive costs plus corrective maintenance costs plus lost revenues costs.
If you presently do no preventive maintenance tasks at all, then each dollar of effort
for preventive tasks will probably gain savings of at least $10 in reduced corrective
maintenance costs and increased revenues. As the curve shows, increasing the invest-
ment in preventive maintenance will produce increasingly smaller returns as the
breakeven point is approached. The total-cost curve bottoms out, and total costs begin
to increase again beyond the breakeven point. You may wish to experiment by going
past the minimum-cost point some distance toward more preventive tasks. Even
though costs are gradually increasing, subjective measures, including reduced confu-
sion, safety, and better management control, that do not show easily in the cost cal-
culations are still being gained with the increased preventive maintenance. How do
you track these costs? Figure 2–8 shows a simple record-keeping spreadsheet that
helps keep data on a month-by-month basis.