
Page 126 - An Introduction to Analytical Atomic Spectrometry - L. Ebdon
P. 126
Page 109
in which the MIP is launched using a surface wave. The temperature of the helium MIP is difficult to
define as it is not in LTE. The excitation temperature is in the region of 5000-7000 K, but the neutral
gas temperature is between 1000 and 2000 K. However, the presence of high-energy electrons and
metastable excited-state species means that the MIP is a highly efficient excitation source. If helium is
used as the plasma gas, the existence of high-energy helium metastable species means that elements
such as chlorine, fluorine, nitrogen and oxygen are excited efficiently.
Although inexpensive and compact, the microwave plasma suffers from low tolerance to solution
samples and from chemical interferences. The latter arise because of the low gas temperature. These
problems can be overcome to some extent by using a high-power MIP (up to 1.5 kW), although this
increases the complexity of the generator and tuning network, and requires the use of a high gas-flow
tangential torch, much like the ICP. The MIP has found its greatest application as an element -selective
detector for gas chromatography. The advantages of element-selective detection are that compounds
which elute from a gas chromatograph can be identified unequivocally with respect to their constituent
atoms, and not just on the basis of their retention time. Organometallic species containing tin, mercury
and lead can be determined down to picogram levels. Other applications include the determination of
phosphorus and sulphur in oils and halogenated pesticides. These advantages have been exploited in
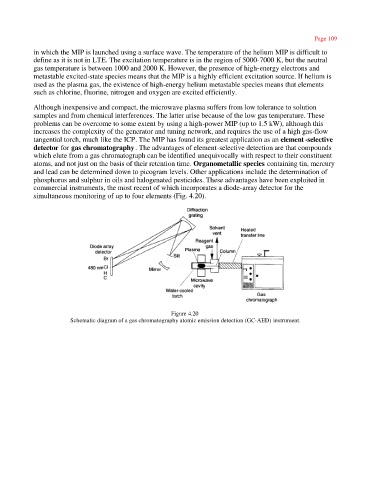
commercial instruments, the most recent of which incorporates a diode-array detector for the
simultaneous monitoring of up to four elements (Fig. 4.20).
Figure 4.20
Schematic diagram of a gas chromatography atomic emission detection (GC-AED) instrument.