
Page 164 - An Introduction to Analytical Atomic Spectrometry - L. Ebdon
P. 164
Page 149
into the atom cell. The process can be performed in batch mode or in continuous operation.
In most arrangements used for AAS, the batch mode of operation is preferred (Fig. 7.2a). The acidified sample
is transported into a stirred glass cell containing 1% w/v aqueous sodium borohydride. The contents are mixed
and the liberated hydrides flushed with an inert gas into either
(i) a flame, often an argon-hydrogen diffusion flame;
(ii) a narrow-bore silica tube mounted over an air-acetylene flame (in one design there is a transverse flow of
nitrogen at the ends of the tube to ensure the liberated hydrogen does not burn in the light path—some results
from such a system are shown in Table 7.1);
(iii) a narrow-bore silica tube, electrically heated by means of a winding of suitable resistance wire.
The use of narrow-bore tubing results in much improved limits of detection by limiting the dilution of the
hydrides. Using arrangement (ii) or (iii), background correction is usually unnecessary, provided that
hydrogen is not allowed to burn in the optical axis.
Hydrides may also be determined using atomic fluorescence detectors. Several commercial instruments are
now available that specialize in the determination of specific analytes. One example is an HG-AFS system for
the determination of As and Se.
The introduction of hydrides into plasma-based instrumentation has also been achieved. The sensitivity
increases markedly when compared with conventional nebulization because of the improved transport
efficiency of the analyte to the atom cell (close to 100%). Often, a membrane gas-liquid separator is used to
ensure that aerosol droplets of liquid do not reach the plasma.
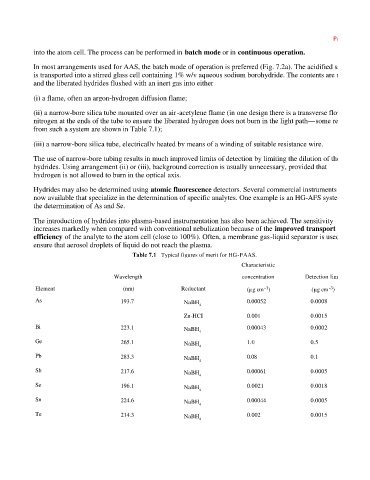
Table 7.1 Typical figures of merit for HG-FAAS.
Characteristic
Wavelength concentration Detection limit
-3
-3
Element (nm) Reductant (µg cm ) (µg cm )
As 193.7 NaBH 4 0.00052 0.0008
Zn-HCI 0.001 0.0015
Bi 223.1 NaBH 4 0.00043 0.0002
Ge 265.1 NaBH 4 1.0 0.5
Pb 283.3 NaBH 4 0.08 0.1
Sb 217.6 NaBH 4 0.00061 0.0005
Se 196.1 NaBH 4 0.0021 0.0018
Sn 224.6 NaBH 4 0.00044 0.0005
Te 214.3 NaBH 4 0.002 0.0015