
Page 191 - An Introduction to Analytical Atomic Spectrometry - L. Ebdon
P. 191
Page 177
B.7.3 Theory
Quadrupole mass spectrometers and their associated ion optics do not transmit ions of different mass
equally. In other words, if an elemental solution composed of two isotopes with an exactly 1:1 ratio is
analysed using ICP-MS, then a 1:1 isotopic ratio will not necessarily be observed. In practice,
transmission through the quadrupole increases up to the mid-mass range (ca m/z 120), then levels off or
decreases gradually up to m/z 255. This so-called mass bias will differ depending on mass, with the
greatest effects occurring at low mass, the least effect in the mid-mass range and intermediate effects at
high mass. Even very small mass biases can have deleterious effects on the accuracy of isotope ratio
determinations, so a correction must always be made using an isotopic standard of known composition,
as shown in Eqn. B.1.
where C = mass bias correction factor, R = true isotopic ratio for the isotope pair and R = observed
0
t
isotope ratio for the isotope pair. This correction factor will be applied to the isotope ratio determined
for the sample.
B.7.3.1 Sample Preparation
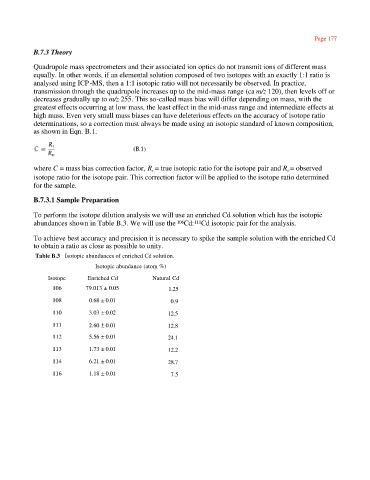
To perform the isotope dilution analysis we will use an enriched Cd solution which has the isotopic
abundances shown in Table B.3. We will use the Cd: Cd isotopic pair for the analysis.
106
111
To achieve best accuracy and precision it is necessary to spike the sample solution with the enriched Cd
to obtain a ratio as close as possible to unity.
Table B.3 Isotopic abundances of enriched Cd solution.
Isotopic abundance (atom %)
Isotope Enriched Cd Natural Cd
106 79.013 ± 0.05 1.25
108 0.68 ± 0.01 0.9
110 3.03 ± 0.02 12.5
111 2.60 – 0.01 12.8
112 5.56 ± 0.01 24.1
113 1.73 ± 0.01 12.2
114 6.21 ± 0.01 28.7
116 1.18 ± 0.01 7.5