
Page 299 - Analytical method for food addtives
P. 299
This is attributed to analytical interference due to the nature
The results given by the 2 methods are highly correlated,
although there are systematic differences between them.
CV % ranged from 2.3–7.2 % for phosphatidylcholine.
HPLC Method: Precision 3.7 %. Calibration linear.
Detection limit 0.399 µg/mL, quantitation limit
0.599 µg/mL for phosphatidylcholine.
of the samples
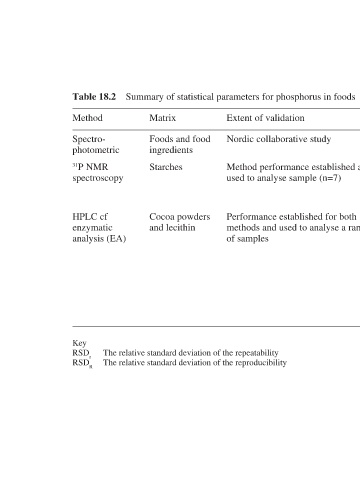
Summary of statistical parameters for phosphorus in foods
Extent of validation Reference Statistical parameters 2 g gP/100 1.1–5.4 % for 0.96–0.29 RSD r Nordic collaborative study g (see Table 18.3) gP/100 3.6–7.7 % for 0.96–0.23 RSD R 3 Various starches were analysed in duplicate and results for Method performance established and total phosphorus were in agreement with those
of samples
Foods and food Cocoa powders and lecithin The relative standard deviation of the repeatability The relative standard deviation of the reproducibility
Matrix ingredients Starches
Table 18.2 Method Spectro- photometric 31 P NMR spectroscopy HPLC cf enzymatic analysis (EA) Key RSD r RSD R