
Page 49 - Analytical method for food addtives
P. 49
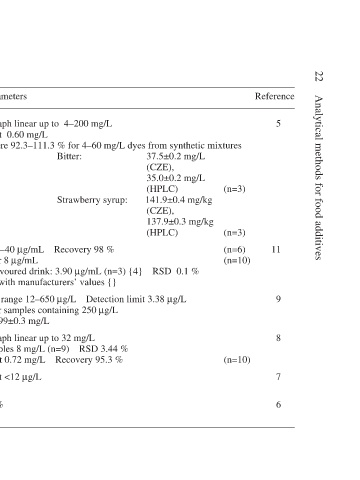
22  Analytical methods for food additives


                   Reference  5     (n=3)   (n=3)  11  (n=6)  (n=10)  9  8  (n=10)  7  6


                            mg/L dyes from synthetic mixtures  mg/L 37.5±0.2  (CZE),  mg/L 35.0±0.2  (HPLC)  mg/kg  (CZE),  mg/kg 137.9±0.3  (HPLC)  % RSD  0.1  µg/L


                        mg/L  % for 4–60  Bitter:  Strawberry syrup:       141.9±0.4  % Recovery 98  µg/mL (n=3) {4}  Detection limit 3.38  µg/L  µg/L  mg/L  % RSD 3.44 mg/L (n=9)  % Recovery 95.3


                   Statistical parameters  Calibration graph linear up to  4–200  mg/L Detection limit  0.60 Recoveries were 92.3–111.3  Real samples:  µg/mL Linear range 0–40  µg/mL  % for 8 RSD 1.1 Strawberry flavoured drink: 3.90 Results agree with manufacturers’ values {}  Concentration range 12–650 % for samples containing 250  RSD 1.3  mg/L Car


                   Extent of validation  Performance of method established and applied  to real samples  Performance of method established and applied  to real samples  Performance of method  established and applied  to 4 real samples (n=3)  Performance of method established and applied  to real samples  Method applied to  confectionery  Method speci


                        Non-alcoholic  beverages and  Soft drinks  Colourings,  confectionery  Beverages,  Confectionery

                   Matrix   flavoured  syrups              caramel,  gelatine,  syrups  Yogurt

               Table 2.2 cont’d  Method  CZE cf  HPLC 3  Spectro-  photometric  SP spectro-  photometry  Spectro-  photometric  HPLC  HPLC