
Page 171 - Anatomy of a Robot
P. 171
06_200256_CH06/Bergren 4/10/03 12:00 PM Page 156
156 CHAPTER SIX
COMPARISONS
Sometimes we can find systems that must perform tasks similar to what our robot must
perform. For instance, if the robot must weigh 3,000 lbs. and carry 4 people up a moun-
tain road, we can just look to a similar sized car and try to emulate its engine and
mileage. If the robot must shred celery into small edible bites, we can take apart our
Cuisinart and see what kind of motor it has. For that matter, if the comparisons are very
close, perhaps we can chop down a Volkswagen or a Cuisinart, build it into our robot,
and be done with it!
Don’t forget that we have been calculating and measuring the energy required to
move the robot. We must also provide energy to power the computer systems, sensors,
taillights, and all the other circuits on the robot.
Once we have an estimate of the energy that’s required, we must back off a bit and
add some design margin to the robot. As a practical matter, theoretical calculations of
work are very rough. Motor inefficiencies, friction, and many other inefficiencies use
up energy from the battery in useless work. It makes more sense to have a 4:1 (or higher)
ratio of energy to required energy. Translated to efficiency, we only expect our robot to
be 25 percent efficient. If the robot is going into space, the designers will want to do
better. If the robot is going across the room, more margin for error exists since it can be
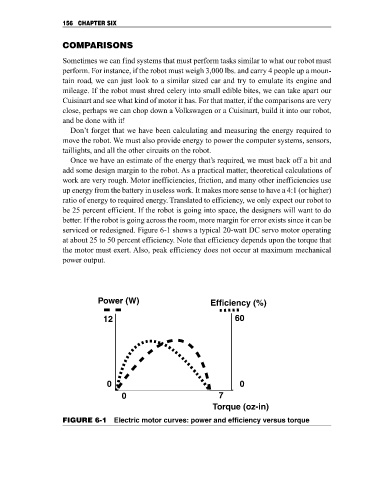
serviced or redesigned. Figure 6-1 shows a typical 20-watt DC servo motor operating
at about 25 to 50 percent efficiency. Note that efficiency depends upon the torque that
the motor must exert. Also, peak efficiency does not occur at maximum mechanical
power output.
Power (W) Efficiency (%)
12 60
0 0
0 7
Torque (oz-in)
FIGURE 6-1 Electric motor curves: power and efficiency versus torque