
Page 141 - Anthropometry, Apparel Sizing and Design
P. 141
inseam distribution. group) per (percentage groups Age Asian years 66 56–65 46–55 36–45 26–35 18–25 American/ over and years years years years years others 20 27 18 16 11 9 18 45 50 50 48 47 42 50 31 22 27 31 36 40 25 1 2 4 4 5 8 2
American group) per
Asian (percentage Hispano- American 18 50 26 3
and American
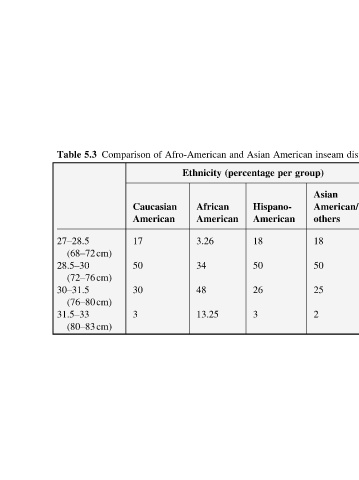
Afro-American Ethnicity African 3.26 34 48 13.25
of Caucasian American
Comparison 17 50 30 3
5.3 (68–72cm) (72–76cm) (76–80cm) (80–83cm)
Table 27–28.5 28.5–30 30–31.5 31.5–33