Page 34 - Applied Numerical Methods Using MATLAB
P. 34

BASIC OPERATIONS OF MATLAB  23
            1. Random Number Having Uniform Distribution
            The numbers in a matrix generated by the MATLAB function rand(M,N) have
            uniform probability distribution over the interval [0,1], as described by U(0,1).
            The random number x generated by rand() has the probability density function

                                                1  ∀x ≥ 0
             f X (x) = u s (x) − u s (x − 1)  (u s (x) =  : the unit step function)
                                                0 ∀x< 0
                                                                         (1.1.1)
            whose value is 1 over [0,1] and 0 elsewhere. The average of this standard uniform
            number x is
                                                             1
                                  ∞
                               
               
  1       2
                                                         x     1
                          m X =     xf X (x)dx =  xdx =       =          (1.1.2)
                                 −∞             0        2    0  2
            and its variance or deviation is
                     
                     
  1                       1
                       ∞                           1       1             1
                 2              2                    2           1
                σ =     (x − m X ) f X (x)dx =  (x − ) dx =  (x − )  3    =
                 X                                 2       3     2       12
                      −∞                    0                        0
                                                                         (1.1.3)
              If you want another random number y with uniform distribution U(a, b), trans-
            form the standard uniform number x as follows:
                                      y = (b − a)x + a                   (1.1.4)
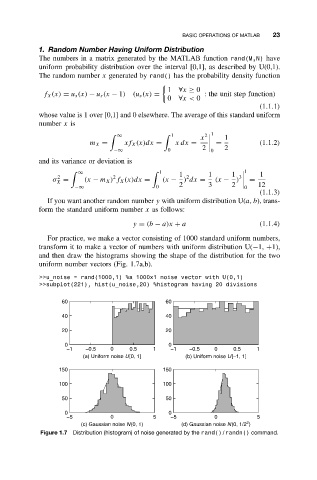
              For practice, we make a vector consisting of 1000 standard uniform numbers,
            transform it to make a vector of numbers with uniform distribution U(−1, +1),
            and then draw the histograms showing the shape of the distribution for the two
            uniform number vectors (Fig. 1.7a,b).

            >>u_noise = rand(1000,1) %a 1000x1 noise vector with U(0,1)
            >>subplot(221), hist(u_noise,20) %histogram having 20 divisions

                  60                           60
                  40                           40

                  20                           20
                   0                            0
                    −1   −0.5   0    0.5    1   −1    −0.5   0    0.5   1
                        (a) Uniform noise U[0, 1]   (b) Uniform noise U[−1, 1]

                 150                          150
                 100                          100

                  50                           50
                   0                            0
                    −5          0           5   −5           0          5
                                                                     2
                       (c) Gaussian noise N(0, 1)  (d) Gaussian noise N(0, 1/2 )
            Figure 1.7 Distribution (histogram) of noise generated by the rand()/randn() command.
   29   30   31   32   33   34   35   36   37   38   39