
Page 279 - Applied Petroleum Geomechanics
P. 279
270 Applied Petroleum Geomechanics
Pressure (psi)
0 10002000300040005000600070008000900010000
0
Normal pressure
1000 Hydrostatic
Overpressure
OBP
2000
3000
4000
Depth (ft) 5000
6000
7000
8000
9000
10000
11000
12000
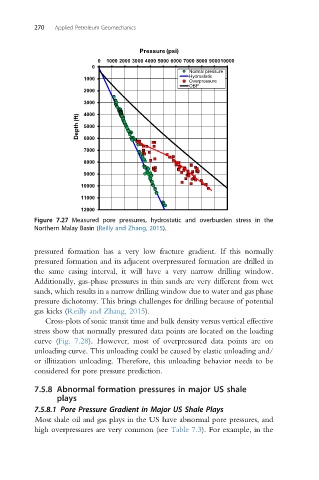
Figure 7.27 Measured pore pressures, hydrostatic and overburden stress in the
Northern Malay Basin (Reilly and Zhang, 2015).
pressured formation has a very low fracture gradient. If this normally
pressured formation and its adjacent overpressured formation are drilled in
the same casing interval, it will have a very narrow drilling window.
Additionally, gas-phase pressures in thin sands are very different from wet
sands, which results in a narrow drilling window due to water and gas phase
pressure dichotomy. This brings challenges for drilling because of potential
gas kicks (Reilly and Zhang, 2015).
Cross-plots of sonic transit time and bulk density versus vertical effective
stress show that normally pressured data points are located on the loading
curve (Fig. 7.28). However, most of overpressured data points are on
unloading curve. This unloading could be caused by elastic unloading and/
or illitization unloading. Therefore, this unloading behavior needs to be
considered for pore pressure prediction.
7.5.8 Abnormal formation pressures in major US shale
plays
7.5.8.1 Pore Pressure Gradient in Major US Shale Plays
Most shale oil and gas plays in the US have abnormal pore pressures, and
high overpressures are very common (see Table 7.3). For example, in the