
Page 212 - Applied Photovoltaics
P. 212
x increasing costs of transmission and distribution (owing, for instance, to
equipment and labour price escalations, new requirements for underground
construction etc.)
x increasing difficulty in acquiring rights-of-way for transmission lines and
sites for substations, owing to environmental, electromagnetic field or other
concerns
x possibility of changes to regulations, subsidies, taxation regimes etc., which
currently favour fossil fuel intensive energy systems.
10.6.4 Example 1—Distribution Feeder 1103, Kerman, California
Pacific Gas & Electric (PG&E), a major Californian utility, has investigated the
relevance of distributed photovoltaic systems in their network. A small sub-section,
the ‘Kerman Feeder 1103’ has been analysed in some detail (Shugar, 1990) to
evaluate the electrical impact and economics of connecting in a 500 kW p photovoltaic
array. The 500 kW p Kerman substation began commercial operation in June 1993
(Wenger et al., 1994), after construction at a cost of $US12.34/W p (modules
US$9/W p and BOS US$3.34/W p ) (Solar Flare, 1993). Of this cost, US$1.14/W p was
attributed to the experimental nature of the system.
Fig. 10.8 showed the feeder load and the Kerman single-axis tracking PV array output
throughout the day of peak load in 1993–94 (Wenger, 1994). The peak is significantly
reduced and transformer temperature reduced by 4°C at the peak time by reduced
heating earlier in the day.
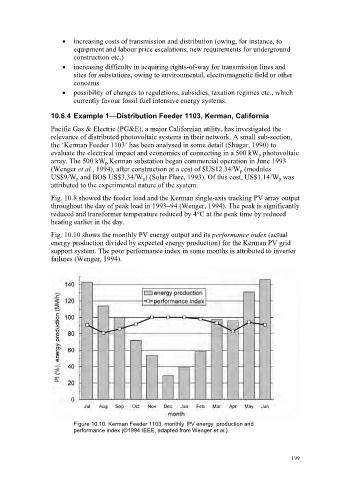
Fig. 10.10 shows the monthly PV energy output and its performance index (actual
energy production divided by expected energy production) for the Kerman PV grid
support system. The poor performance index in some months is attributed to inverter
failures (Wenger, 1994).
Figure 10.10. Kerman Feeder 1103, monthly PV energy production and
performance index (©1994 IEEE, adapted from Wenger et al.).
199